. 2011 Jan;7(1):17-26.
doi: 10.4161/auto.7.1.13840. Epub 2011 Jan 1.

Antibacterial autophagy occurs at PI(3)P-enriched domains of the endoplasmic reticulum and requires Rab1 GTPase

Affiliations

Antibacterial autophagy occurs at PI(3)P-enriched domains of the endoplasmic reticulum and requires Rab1 GTPase

Ju Huang et al. Autophagy. 2011 Jan.

Abstract

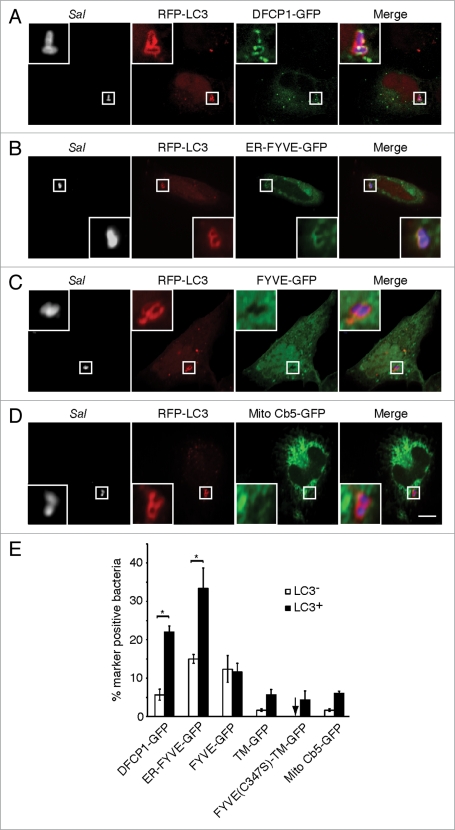
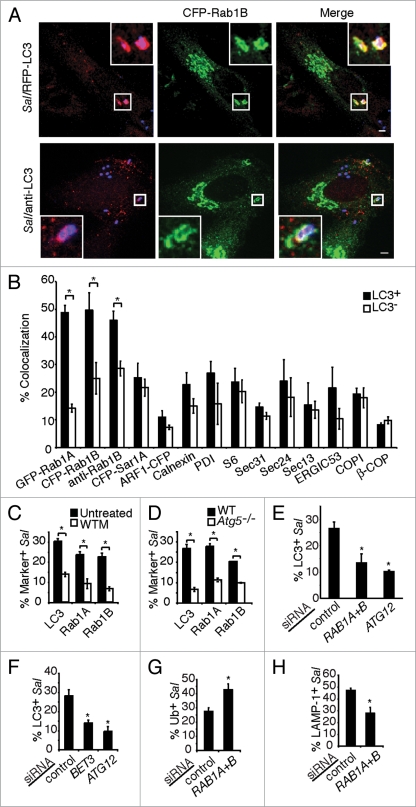
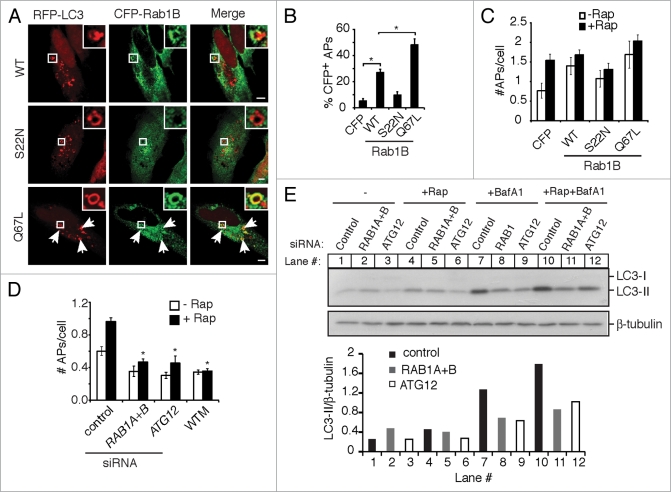
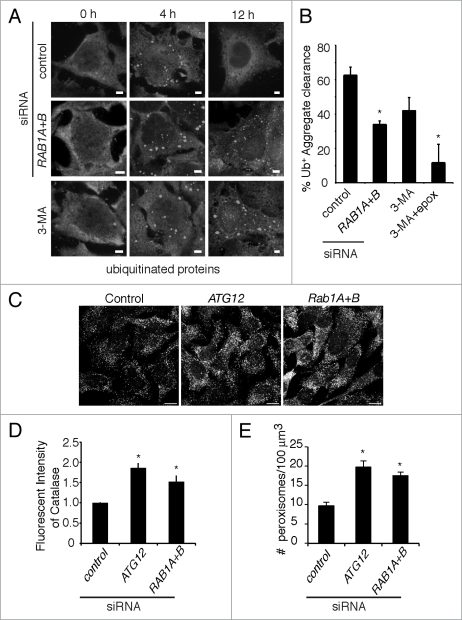
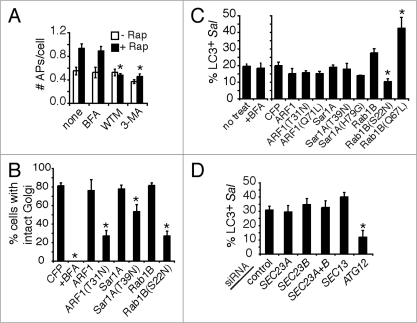
Autophagy mediates the degradation of cytoplasmic components in eukaryotic cells and plays a key role in immunity. The mechanism of autophagosome formation is not clear. Here we examined two potential membrane sources for antibacterial autophagy: the ER and mitochondria. DFCP1, a marker of specialized ER domains known as 'omegasomes,' associated with Salmonella-containing autophagosomes via its PtdIns(3)P and ER-binding domains, while a mitochondrial marker (cytochrome b5-GFP) did not. Rab1 also localized to autophagosomes, and its activity was required for autophagosome formation, clearance of protein aggregates and peroxisomes, and autophagy of Salmonella. Overexpression of Rab1 enhanced antibacterial autophagy. The role of Rab1 in antibacterial autophagy was independent of its role in ER-to-Golgi transport. Our data suggest that antibacterial autophagy occurs at omegasomes and reveal that the Rab1 GTPase plays a crucial role in mammalian autophagy.


Figures

Figure 1
Figure 1
DFCP1 associates with bacteria-containing autophagosomes via its PtdIns(3) P and ER-binding domains. HeLa cells were co-transfected with RFP-LC3 and either DFCP1-GFP (A) ER-FYVE-GFP (B) FYVE-GFP (C) or Mito Cb5-GFP (D). Cells were infected with S. typhimurium (Sal) for 1 h and immunostained with a polyclonal antibody to S. typhimurium. Representative confocal z-slices are shown, with the insets representing a higher magnification of the boxed area. Size bar, 10 µm. The percentage of LC3 or LC3+ bacteria co-localizing with each indicated marker was determined by fluorescence microscopy and quantified in (E). Asterisks indicate a significant difference, p < 0.05.
Figure 2
Figure 2
Rab1 is involved in autophagy of S. typhimurium. (A) HeLa cells were co-transfected with RFP-LC3 and CFP-Rab1B (upper part) or transfected with CFP-Rab1B alone and immunostained with a rabbit polyclonal antibody against endogenous LC3 (anti-LC3) (lower part), then infected with S. typhimurium for 1 h. Magnified images of boxed areas are shown in the upper right or lower left corners, indicating LC3+ S. typhimurium (Sal) labeling with CFP-Rab1B. Size bars, 5 µm. (B) Quantification of fluorescently-labeled GTPase constructs or immunostaining of indicated protein markers with RFP-LC3+ or LC3 bacteria. (C) Cells were transfected and infected as in (A) and either treated or not treated with wortmannin (WTM) for 30 min prior to infection. The percentage of bacteria positive for the indicated constructs was quantified. (D) Wild-type or Atg5−/− MEFs were transfected and infected as in (A). The percentage of bacteria positive for the indicated constructs was quantified as in (C). Asterisks indicate a significant difference, p < 0.05. (E) HeLa cells were treated with control, RAB1 and ATG12 siRNA or (F) BET3 siRNA, transfected with GFP-LC3 and infected with S. typhimurium expressing RFP for 1 h. The percentage of LC3+ bacteria was quantified. (G) Cells were treated with siRNA and infected as in (E), and then stained for ubiquitinated proteins. The percentage of S. typhimurium colocalizing with ubiquitinated proteins was quantified as in (E). (H) Cells were treated with siRNA and infected as in (E) and stained for the vacuole marker LAMP-1. The percentage of LAMP-1+ bacteria was quantified as in (E). Asterisks indicate a significant difference from control siRNA levels, p < 0.05.
Figure 3
Figure 3
Rab1 is associated with autophagosomes and its activity is required for their formation. (A) HeLa cells were co-transfected with RFP-LC3 and the indicated CFP-Rab1B constructs, then treated with rapamycin for 2 h to induce autophagy. Magnified images of boxed areas are shown in the upper right corners. Arrows indicate further instances of CFP-Rab1B(Q67L) colocalization with autophagosomes. Size bars, 5 µm. (B) Quantification of the colocalization of CFP-Rab1B constructs with autophagosomes (APs) (RFP-LC3+ round vacuoles with clearly visible hollow centers). Asterisks indicate a significant difference, p < 0.05. (C) Cells were transfected as in (A) and either left untreated (−Rap) or treated with rapamycin for 2 h (+Rap). The average number of autophagosomes (APs) per transfected cell was quantified. (D) HeLa cells treated with the indicated siRNAs were transfected with GFP-LC3 and treated with (+) or without (−) rapamycin for 2 h. The number of autophagosomes (APs) per cell was quantified. In a parallel experiment, cells were treated with the autophagy inhibitor WTM during rapamycin treatment. Asterisks indicate a significant difference from control siRNA levels (+Rap), p < 0.05. (E) HeLa cells treated with the indicated siRNAs were incubated in the absence (−) or presence of rapamycin (+Rap), in the presence of bafilomycin A1 (BafA1) alone or rapamycin and bafilomycin A1 together (+Rap+BafA1) for 2 h. Then cells were lysed, harvested and analyzed by western blot. Endogenous LC3-I and LC3-II were detected by a rabbit polyclonal antibody. β-tubulin serves as a loading control. Densitometry was performed using ImageJ software and the ratio of LC3-II to β-tubulin density is plotted below.
Figure 4
Figure 4
Rab1 is required for autophagy-mediated clearance of ubiquitinated protein aggregates and peroxisomes. (A) HeLa cells were treated with the indicated siRNAs. Puromycin was added to the cells for 4 h to induce ubiquitinated protein aggregate formation, followed by extensive washing. Aggregate clearance was followed for a further 8 h (12 h total). Cells were fixed and stained for ubiquitinated proteins (with the FK2 antibody) to visualize aggregates. In a parallel experiment, cells were treated with the autophagy inhibitor 3-methyladenine (3-MA) immediately after puromycin removal. Size bars, 5 µm. (B) Quantification of the percentage of cells that cleared all aggregates by 8 h after puromycin removal. Where indicated, cells were treated with 3-MA with or without the proteasome inhibitor epoxomicin (epox) immediately after puromycin removal. Asterisks indicate a significant difference from cells treated with control siRNA, p < 0.05. (C) HeLa cells were transfected with indicated siRNAs, then fixed and immunostained for catalase and visualized using anti-rabbit Alexa 488 antibody. Size Bar, 10 µm. (D) The total fluorescent intensity from the fluorescent signal of endogenous catalase was measured as described in the Materials and Methods. The error bars indicate the standard deviations from at least 75 cells. Asterisks indicate a significant increase in catalase intensity compared to control siRNA-treated cells, p < 0.05. (E) In a parallel experiment to D, the number of fluorescently labeled catalase-positive structures or peroxisomes, was quantified as described in the Materials and Methods. The number of perxisomes per 100 µm3 in both isoforms of RAB1 or ATG12 siRNA-treated cells was compared with that in control siRNA-treated cells. Asterisks indicate a significant increase in peroxisome numbers, p < 0.05.
Figure 5
Figure 5
Rab1 is involved in autophagy independent of its role in ER-to-Golgi transport. (A) HeLa cells were transfected with GFP-LC3 and treated with rapamycin for 2 h. Where indicated, cells were also treated with Brefeldin A (BFA), WTM or 3-MA. The number of autophagosomes (APs) per cell was quantified. Asterisks indicate a significant difference from no treatment (none) levels (+Rap), p < 0.05. (B) Cells were transfected with the indicated dominant negative CFP-GTPase constructs or treated with BFA, then fixed and stained with a monoclonal antibody to giantin to visualize the Golgi. The percentage of cells with intact Golgi stacks after the indicated treatment/CFP-GTPase transfection was quantified. Asterisks indicate a significant difference from the CFP-transfected control, p < 0.05. (C) Cells were co-transfected with RFP-LC3 and the indicated CFP-GTPase constructs and infected with S. typhimurium for 1 h. The colocalization of bacteria with LC3 was quantified only in transfected cells. In parallel experiments, cells were treated with BFA during infection. Asterisks indicate a significant difference from the CFP-transfected control, p < 0.05. (D) HeLa cells were treated with the indicated siRNAs, transfected with GFP-LC3 and infected with S. typhimurium expressing RFP for 1 h. The percentage of LC3+ bacteria was quantified. The asterisk indicates a significant difference from control siRNA levels, p < 0.05.

References

    1. Levine B, Kroemer G. Autophagy in the pathogenesis of disease. Cell. 2008;132:27–42. - PMC - PubMed
    1. Mizushima N, Levine B, Cuervo AM, Klionsky DJ. Autophagy fights disease through cellular self-digestion. Nature. 2008;451:1069–1075. - PMC - PubMed
    1. Hailey DW, Rambold AS, Satpute-Krishnan P, Mitra K, Sougrat R, Kim PK, et al. Mitochondria supply membranes for autophagosome biogenesis during starvation. Cell. 2010;141:656–667. - PMC - PubMed
    1. Axe EL, Walker SA, Manifava M, Chandra P, Roderick HL, Habermann A, et al. Autophagosome formation from membrane compartments enriched in phosphatidylinositol 3-phosphate and dynamically connected to the endoplasmic reticulum. J Cell Biol. 2008;182:685–701. - PMC - PubMed
    1. Dunn WA., Jr Studies on the mechanisms of autophagy: formation of the autophagic vacuole. J Cell Biol. 1990;110:1923–1933. - PMC - PubMed

Publication types

MeSH terms