. 2011 Mar;4(2):172-85.
doi: 10.1038/mi.2010.67. Epub 2010 Oct 27.

The TNF-family cytokine TL1A drives IL-13-dependent small intestinal inflammation

Affiliations

The TNF-family cytokine TL1A drives IL-13-dependent small intestinal inflammation

F Meylan et al. Mucosal Immunol. 2011 Mar.

Abstract

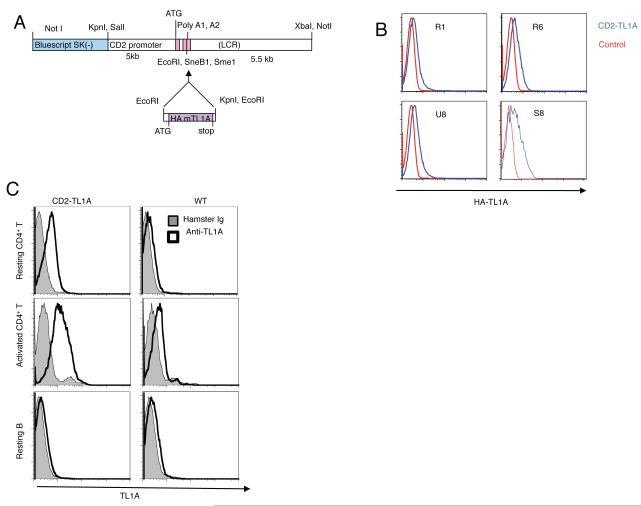
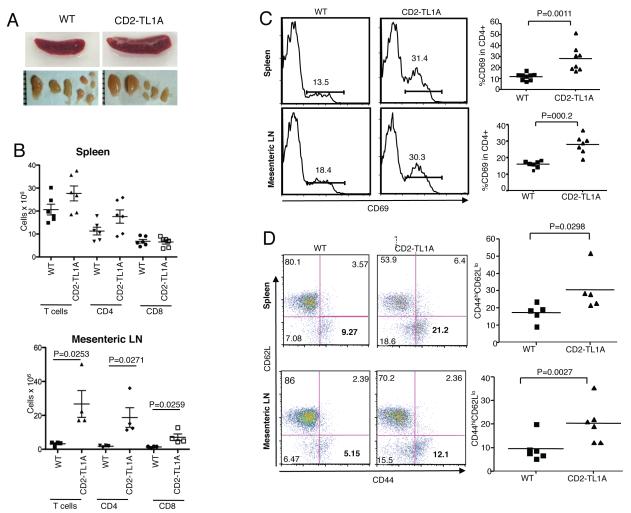
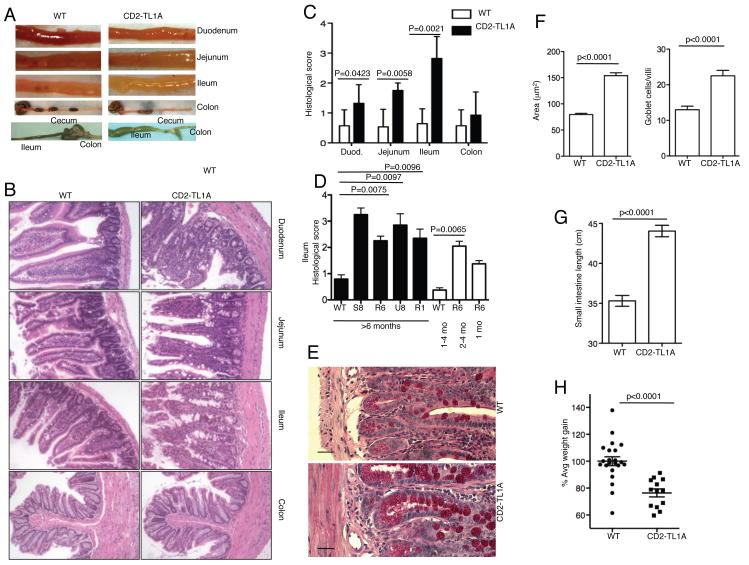
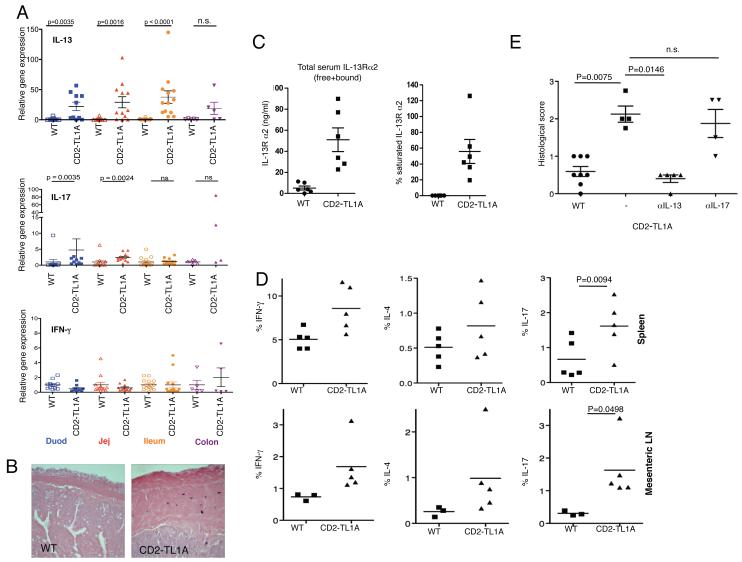
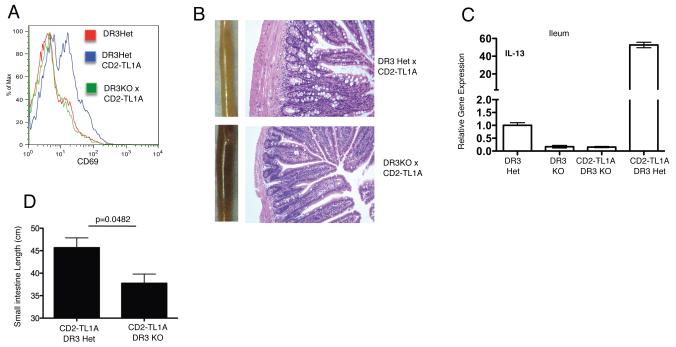
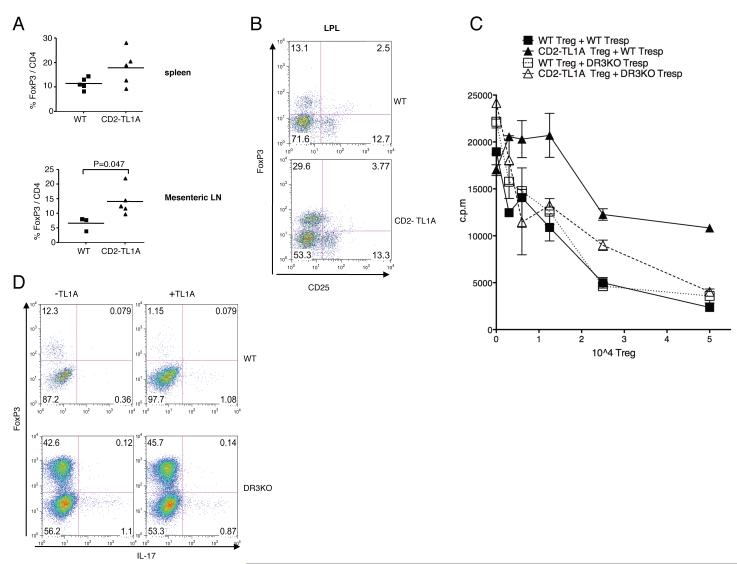
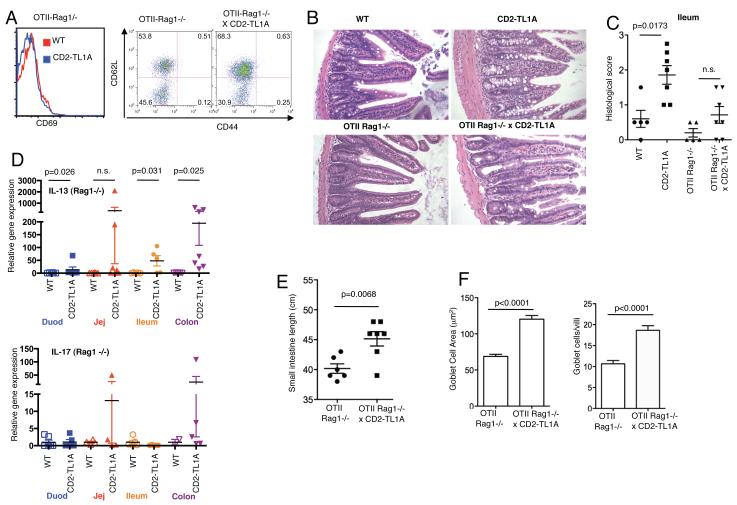
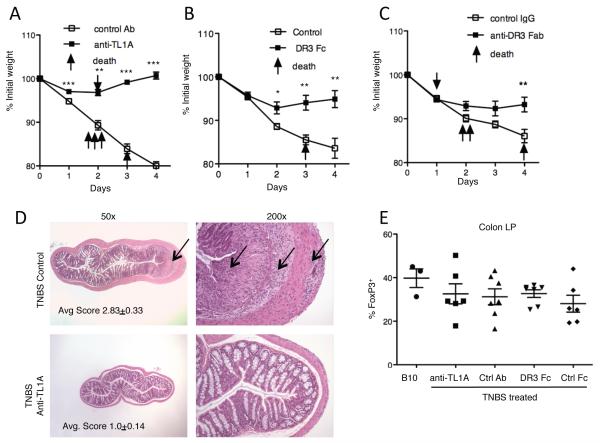
The tumor necrosis factor (TNF)-family cytokine TL1A (TNFSF15) costimulates T cells through its receptor DR3 (TNFRSF25) and is required for autoimmune pathology driven by diverse T-cell subsets. TL1A has been linked to human inflammatory bowel disease (IBD), but its pathogenic role is not known. We generated transgenic mice that constitutively express TL1A in T cells or dendritic cells. These mice spontaneously develop IL-13-dependent inflammatory small bowel pathology that strikingly resembles the intestinal response to nematode infections. These changes were dependent on the presence of a polyclonal T-cell receptor (TCR) repertoire, suggesting that they are driven by components in the intestinal flora. Forkhead box P3 (FoxP3)-positive regulatory T cells (Tregs) were present in increased numbers despite the fact that TL1A suppresses the generation of inducible Tregs. Finally, blocking TL1A-DR3 interactions abrogates 2,4,6 trinitrobenzenesulfonic acid (TNBS) colitis, indicating that these interactions influence other causes of intestinal inflammation as well. These results establish a novel link between TL1A and interleukin 13 (IL-13) responses that results in small intestinal inflammation, and also establish that TL1A-DR3 interactions are necessary and sufficient for T cell-dependent IBD.


Figures

Figure 1
Figure 1. Generation and TL1A expression in CD2-TL1A transgenic mice
(A) Schematic of CD2-TL1A transgenic construct illustrating placement of the mouse TL1A-HA cDNA in the CD2 promoter-enhancer cassette. (B) Comparison of transgene expression in four independent founder lines of CD2-TL1A transgenic mice assayed by intracellular flow cytometry of anti-HA on CD3-gated splenocytes from transgenic (blue) and control (red) mice. (C) Transgenic vs. endogenous cell surface TL1A expression assayed by flow cytometry with anti-TL1A mAb 5.4G6 vs control hamster Ig on resting CD4+ T cells isolated from spleen and lymph nodes (top), on CD4+ T cells 48 hours after activation with anti-CD3/anti-CD28 (middle), and on resting B cells gated on B220 (bottom) from line R6 CD2-TL1A transgenic and control C57BL/6 mice.
Figure 2
Figure 2. Characterization of the T cell compartment in TL1A transgenic mice
(A) Gross appearance of spleen and mesenteric lymph nodes from C57BL/6 wild-type and line R6 CD2-TL1A transgenic mice over 3 months of age. (B) Absolute number of T cells, CD4+ T cells and CD8+ T cells from spleen and mesenteric lymph nodes from line R6 CD2-TL1A transgenic mice 20-24 weeks old and age-matched controls. (C) Representative flow cytometric profiles and compilation of the percentage of CD69+ cells as a percentage of CD4+ T cells in spleen and mLN from line R6 CD2-TL1A transgenic mice 10-16 weeks of age and age-matched controls. (D) Representative flow cytometric profiles and compilation of the percentage of memory CD44hiCD62Llo cells as a percentage of CD4+T cells in spleen and mLN from line R6 CD2-TL1A transgenic mice of 10-16 weeks old and age-matched controls. Statistical analysis for comparison of percentages of the indicated subsets in transgenic and control mice was performed by unpaired two-tailed Student’s t-test.
Figure 3
Figure 3. TL1A transgenic develop spontaneous inflammatory bowel disease
(A) Gross appearance of the indicated sections of intestine from 3 month old line R6 CD2-TL1A Tg mice and age-matched controls, with an example of the appearance of the grossly distended ileum from a 1.5 year old CD2-TL1A Tg mice, compared with an aged-matched control mice in the bottom panel. (B) H&E stained tissue sections of the indicated portions of intestine from a 3 month old line R6 CD2-TL1A Tg mouse compared with a littermate control. (C) Compilation of histological scores of all 4 founders over 6 months of age for each section. Each section was scored by an observer blinded to the genotype of the mouse. Statistical analysis for comparison of transgenic and control mice was performed by Mann-Whitney test. Sections from at least 4 mice per group were scored. (D) Comparison of histological scores from the ileum of mice from 4 independent founders of CD2-TL1A Tg mice, with at least 5 sections scored for each group of the indicated age (except for line S8 and 1 month old line R6, n=2). Statistical analysis for comparison of transgenic and control mice was performed by Mann-Whitney test. (E) Goblet cell hyperplasia in the Ileum of CD2-TL1A line R6 transgenic mouse and WT control. PAS staining, scale bar = 50 μM (F) Quantitation using Image J software of average goblet cell area and number of goblet cells/villus in sections of ileum from CD2-TL1A line R6 transgenic mice and age matched controls controls (n=5). (G) Small intestinal length (measured from the pylorus to ileocecal valve) of adult WT and CD2-TL1A Tg mice (n>5 each group). Statistical analysis for comparison between transgenic and control mice was performed by unpaired two-tailed Student’s t-test. (H) Comparison of weight gain for the 14 days after weaning of CD2-TL1A Tg mice (line R6). Statistical analysis for comparison between transgenic and control mice was performed by unpaired two-tailed Student’s t-test.
Figure 4
Figure 4. Cytokine expression in CD2-TL1A transgenic mice
(A) mRNA expression of the indicated cytokines was analyzed from the indicated sections of intestine by quantitative RT-PCR from 8-52 week old line R6 CD2-TL1A Tg mice and age-matched controls. Gene expression was normalized first to β2-microglobulin for each sample and then the average gene expression of the control mice for each region of intestine was normalized to 1.0. Statistical significance of comparisons of Tg vs. WT groups is indicated above (Mann-Whitney test). (B) Mast cell accumulation in the submucosa of tissue sections from CD2-TL1A Tg mice. Toluidine blue staining of ileal sections of a 6 months old mouse line R6 TL1A Tg mouse and an age matched control mouse is shown. (C) Soluble IL-13Rα2 and the saturation of IL13Rα2 in sera from CD2 TL1A transgenic mice (line R6) and controls. (D) Intracellular cytokine staining of T cells isolated from the indicated tissues of 8-10 week old CD2-TL1A Tg or control mice stimulated with PMA and ionomycin. The percentage of CD4+ T cells expressing the indicated cytokine is shown, with the average of each group indicated by the line and significant differences between WT and Tg samples indicated (two tailed Student’s t test). (E) Histological analysis of the ileum sections of intestine in CD2-TL1A transgenic mice treated with 10 mg/kg neutralizing antibodies against IL-13 or IL-17 intraperitoneally weekly for 6-8 weeks beginning at 2 weeks of age. Histological scores of non-transgenic littermates and littermates treated with isotype control antibody are shown (statistical analysis using Mann-Withney test). Anti IL-13 antibody data is representative of two independent experiments/
Figure 5
Figure 5. T cell activation and intestinal inflammation in TL1A transgenic mice depend on DR3
CD2-TL1A line R6 transgenic mice were crossed to DR3 deficient mice on a B6 background to generate DR3KO-TL1ATg mice. (A) CD69 expression on the surface of TCRb+CD4+ T cells from the spleens of mice of the indicated genotypes of 20-24 week old mice. (B) Gross and histological appearance of representative ileum sections from mice of the indicated genotypes at 3 months of age. (C) Expression of IL-13 mRNA in the ileum of mice of the indicated genotypes at 8 weeks of age. Numbers are the average of triplicate measurements from 1-2 mice each. (D) Small intestine length of 8-20 week old DR3KO-TL1ATg (n=3) and DR3Het CD2-TL1A Tg mice (n=4). Statistical analysis by two-tailed unpaired Student’s t test.
Figure 6
Figure 6. Effects of TL1A on the frequency, function and generation of regulatory T cells
(A) The percentage of FoxP3 positive CD4+ T cells in the indicated tissues of 8-16 week old CD2-TL1A transgenic and control mice. The line represents the average percent expression. Statistical analysis by two-tailed unpaired Student’s t test. (B) FoxP3 and CD25 expression within CD4+ T cells isolated from the small intestinal lamina propria of representative CD2-TL1A transgenic mice and controls. (C) Treg suppressive assay with 5×10⁴ naive C57BL/6 wild-type or DR3 deficient CD4+ T cells mixed with the indicated number of FoxP3+ Treg from WT or TL1A transgenic mice. Proliferation assayed by 3H thymidine incorporation is shown for triplicate. This data is representative of two independent experiments. (D) Polarization of naive CD4+ T cells of C57BL/6 wild-type or DR3 deficient mice towards iTreg in presence of wild-type APCs. Representative of two experiments using DR3KO mice and controls.
Figure 7
Figure 7. Restriction of the T cell repertoire abolishes peripheral T cell hyperactivation but does not prevent intestinal inflammation in the presence of transgenic TL1A
A) CD69 expression and CD44/CD62L surface expression in splenic CD4+ T cells from 20-24 week old TL1A transgenic and control mice on an OT-II TCR, Rag1−/− background. (B) Representative tissue sections from the ileum of TL1A transgenic and control mice on an OT-II TCR Rag1−/− background, shown with CD2-TL1A Tg and wild-type controls on a C57BL/6 background. (C) Histological scores of ileal sections from a cohort of OT-II TCR Rag1 deficient mice with and without expression of the TL1A transgene and age-matched WT and TL1A transgenic controls from 3-6 months of age. Statistical analysis by Mann-Whitney test. (D) IL-13 and IL-17 mRNA expression in the indicated sections of intestine from TL1A transgenic and control mice on an OT-II TCR Rag1−/− background. Gene expression is normalized to the average of wild-type mice and means and s.e.m. is indicated by the horizontal bars. p values from significant differences using a Mann-Whitney test are given. (E) Small intestinal length from the cohort of mice analyzed in (C). Statistical analysis by two-tailed unpaired Student’s t test. (F) Average goblet cell area and goblet cells per villus calculated from analysis of 5 sections per genotype as in Figure 3. Statistical analysis by two-tailed unpaired Student’s t test.
Figure 8
Figure 8. Dependence of TNBS-induced colitis on TL1A
(A) Weight loss in a cohort of mice induced to develop TNBS colitis with 20 mg/kg anti-TL1A (open squares, n=10) or control hamster Ig (closed squares, n=10) injected i.p on day −1 and 0. Each point represents the average weight of the cohort. Mice that died before the end of the experiment are indicated with arrows. Anti-TL1A data is representative of two independent experiments with minimun of 8 mice per group. ** indicates p<0.01 and *** indicates p<0.0001 by unpaired two-tailed Student’s t-test. (B) TNBS colitis experiment carried out as in (A) with DR3 Fc (closed squares, n=8) and control Fc (open squares, n=8). * indicates p<0.05 and ** indicates p<0.01 by unpaired two-tailed Student’s t-test. (C) TNBS colitis experiment carried out as in (A) with DR3 Fc (closed squares, n=10) and control Fc (open squares, n=10). ** indicates p<0.01 by unpaired two-tailed Student’s t-test. (D) Representative H&E sections of the colon from mice induced to develop TNBS colitis treated with control or anti-TL1A mAb as in (A). Arrow indicates area of severe inflammation of the control Ab treated mouse. Left panels are 50x, and right panels 200x enlargements of thesame sections. Average pathology scores of the mice in (A) at day 6 after induction of colitis are indicated. (E) FoxP3+ cells within CD4+ T cells isolated from colon lamina propria of mice induced to develop TNBS colitis treated with the indicated reagents.

Comment in

  • The tale of TL1A in inflammation.
    Hsu H, Viney JL. Hsu H, et al. Mucosal Immunol. 2011 Jul;4(4):368-70. doi: 10.1038/mi.2011.20. Epub 2011 May 4. Mucosal Immunol. 2011. PMID: 21544073 Review.

References

    1. Screaton GR, Xu XN, Olsen AL, Cowper AE, Tan R, McMichael AJ, et al. LARD: a new lymphoid-specific death domain containing receptor regulated by alternative pre-mRNA splicing. Proc Natl Acad Sci U S A. 1997;94(9):4615–9. - PMC - PubMed
    1. Marsters SA, Sheridan JP, Donahue CJ, Pitti RM, Gray CL, Goddard AD, et al. Apo-3, a new member of the tumor necrosis factor receptor family, contains a death domain and activates apoptosis and NF-kappa B. Curr Biol. 1996;6(12):1669–76. - PubMed
    1. Migone TS, Zhang J, Luo X, Zhuang L, Chen C, Hu B, et al. TL1A is a TNF-like ligand for DR3 and TR6/DcR3 and functions as a T cell costimulator. Immunity. 2002 Mar;16(3):479–92. - PubMed
    1. Meylan F, Davidson TS, Kahle E, Kinder M, Acharya K, Jankovic D, et al. The TNF-family receptor DR3 is essential for diverse T cell-mediated inflammatory diseases. Immunity. 2008 Jul 18;29(1):79–89. - PMC - PubMed
    1. Pappu BP, Borodovsky A, Zheng TS, Yang X, Wu P, Dong X, et al. TL1A-DR3 interaction regulates Th17 cell function and Th17-mediated autoimmune disease. J Exp Med. 2008 May 12;205(5):1049–62. - PMC - PubMed

Publication types

MeSH terms

Substances

LinkOut - more resources