. 2011 Apr;5(4):627-38.
doi: 10.1038/ismej.2010.161. Epub 2010 Oct 28.

Spatial organization of intestinal microbiota in the mouse ascending colon

Affiliations

Spatial organization of intestinal microbiota in the mouse ascending colon

Gerardo M Nava et al. ISME J. 2011 Apr.

Abstract

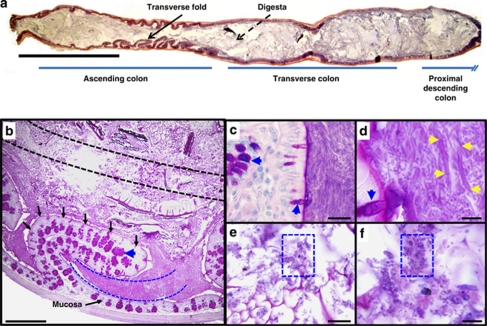
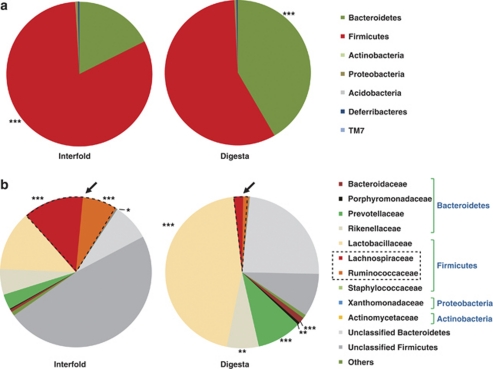
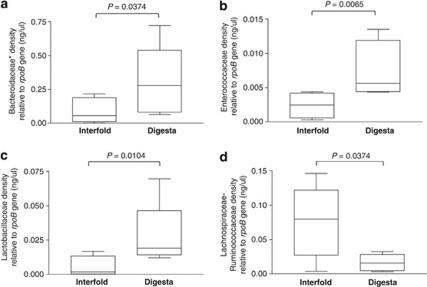
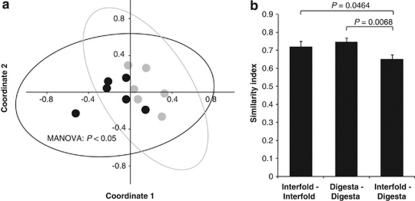
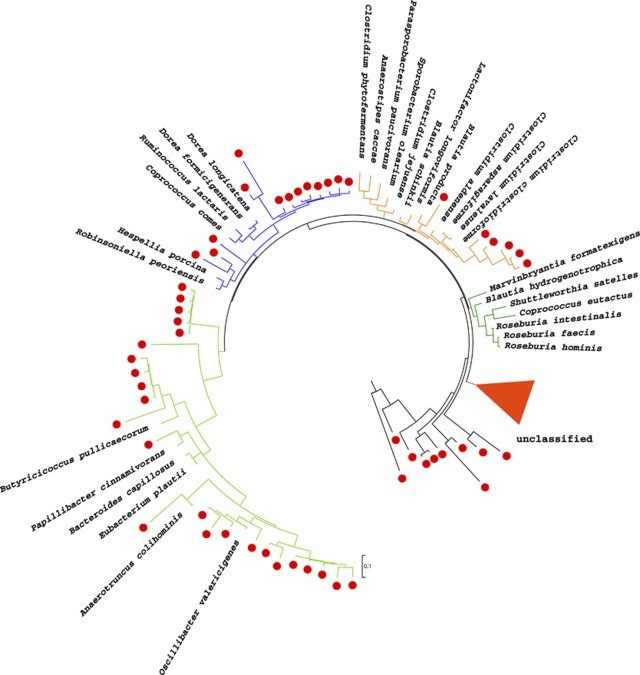
Complex microbial populations are organized in relation to their environment. In the intestine, the inner lining (mucosa) is a potential focal point for such organization. The proximal murine colon contains mucosal folds that are known to be associated with morphologically distinct microbes. To identify these microbes, we used the technique of laser capture microdissection (LCM) to sample microbes associated with these folds (interfold region) and within the central lumen (digesta region). Using 16S rRNA gene tag pyrosequencing, we found that microbes in the interfold region were highly enriched for the phylum Firmicutes and, more specifically, for the families Lachnospiraceae and Ruminococcaceae. Other families such as Bacteroidaceae, Enterococcaceae and Lactobacillaceae were all enriched in the digesta region. This high-resolution system to capture and examine spatial organization of intestinal microbes should facilitate microbial analysis in other mouse models, furthering our understanding of host-microbial interactions.


Figures

Figure 1
Figure 1
A morphologically distinct population of predominately fusiform-shaped bacteria is located between the transverse folds of the mouse ascending colon. (a) Hematoxylin/eosin and (bf) periodic acid-schiff -stained sections of the mouse colon. (a) The proximal portion of the colon (ascending colon) contains transverse folds that project into the lumen (denoted by arrow). The digesta is food particle-associated material in the central lumen (denoted as dashed arrow). (b) Methacarn-fixed section of a mouse ascending colon. The transverse fold (outlined in black arrows) emanates from the mucosa, and is lined by an epithelium that contains periodic acid-schiff-positive goblet cells (denoted as blue arrowhead). Interfold and digesta regions collected by LCM are denoted by blue and black dashed lines, respectively. (c, d) Higher-power views of interfold region. Interlacing fusiform-shaped microbes (denoted as yellow arrowheads) are abundant in this region. (e, f) Higher-power views of the digesta shows rod- and coccoid-shaped microbes (denoted as blue boxes). Bars=5 mm (a), 500 μm (b), 20 μm (c, e), 5 μm (d, f).
Figure 2
Figure 2
Colonic interfold microbes are enriched in Lachnospiraceae and Ruminococcaceae families. Pyrosequencing analysis was used to examine microbial diversity between interfold and digesta regions. (a) Comparisons of diversity at the phylum level. (b) Comparisons of diversity at the family level. Each chart represents the taxonomic composition. Sequences were obtained from pooled samples (n=3) of interfolds (29560 reads) and the digesta (38120 reads) region. Lachnospiraceae and Ruminococcaceae are outlined with a dotted line to highlight these families. Unclassified Bacteroidetes and Firmicutes correspond to sequences not classifiable at family level (as of March 2010). Library Compare tool at RDP estimates the probability of observing a difference in a given taxon. Differences in taxa between interfold and digesta were considered significant if P<0.001. *P<7E-03, **P<2E-11 and ***P=6E-014.
Figure 3
Figure 3
Colonic interfolds harbor higher density of microbes of the families Lachnospiraceae–Ruminococcaceae. (ad) Bacterial densities of interfold and digesta regions were examined using bacterial group-specific qPCR assays. The data depict density of each bacterial group relative to total Bacteria (rpoB gene) as measured by qPCR and DNA standard curves. Bacterial group-specific qPCR signals were normalized (divided) to total Bacteria (rpoB gene) qPCR signal. The rpoB is a gene highly conserved in the Bacteria domain. The asterisk in a indicates that the group queried by this primer set also amplifies 16S rRNA genes of Bacteroidaceae, Porphyromonadaceae and Prevotellaceae. Each PCR assay was performed in triplicate. Bars in each figure represent mean values+s.e. (n=6). Comparisons were made using the Mann–Whitney–Wilcoxon test. Differences were considered significant if P<0.05. Results of qPCR assays are shown in box plots and include their five-number summaries (the smallest observation, lower quartile, median, upper quartile and largest observation).
Figure 4
Figure 4
Lachnospiraceae–Ruminococcaceae populations are distinct in the interfold region compared with the digesta region. Interindividual variation of Lachnospiraceae–Ruminococcaceae was examined by PCR and terminal restriction fragment length polymorphism techniques targeting Lachnospiraceae—Ruminococcaceae-specific 16S rRNA genes. (a) Differences in the structure and composition of this bacterial family between the interfold (black symbols) and digesta (gray symbols) regions were examined by multivariate analysis (n=6). Non-metric multidimensional scaling analysis ordinations derived from the Kulczynski similarity index (presence-absence data). Each symbol is representative of a single sample. Samples are plotted along the first two component axes. The ellipse corresponds to the joint 95% confidence limits. Microbial composition between the two regions was compared using non-parametric MANOVA. (b) Pairwise comparisons of α-diversity (profile similarity between different subjects, that is, interfold versus interfold) and β-diversity (profile similarity across the interfold and digesta regions) were examined by the Kulczynski similarity index (presence-absence data) and inferential statistics. ANOVA and Protected Least-Significant Difference test were used to compare differences in α-diversity and β-diversity. Differences were considered significant at P<0.05.
Figure 5
Figure 5
Candidate genera of families Lachnospiraceae, Ruminococcaceae and Clostridium cluster XIV in the interfold region. To obtain a more precise classification of Lachnospiraceae and Ruminococcaceae bacterial species (Operational Taxonomic Units; OTUs) in the interfold region, Sanger sequencing was performed and reads were analyzed using the Seqmatch search at RDP and phylogenetic analysis. At least 106 OTUs of families Lachnospiraceae, Ruminococcaceae and Clostridium cluster XIV were present in the interfold region (denoted by a red circle). The closest matches for known-type strains were identified and retrieved from RDP using Seqmatch search (see Table 1 for accession numbers, number of sequences in each group and similarity values). Topology of maximum likelihood trees confirmed that these OTUs were related to members of families Lachnospiraceae, Ruminococcaceae and the Clostridium cluster XIV. This tree was rooted using Aquifex pyrophilus, the closest genus to the bacterial last common ancestor. Branches of major clades are depicted by different colors. Branches of unclassified Clostridiales were collapsed (red leave, 51 sequences). The statistical significance of branch order was estimated by the generation of 1000 replications of bootstrap resampling of the originally aligned nucleotide sequences. Scale represents nucleotide substitutions per site.

References

    1. Adekambi T, Shinnick TM, Raoult D, Drancourt M. Complete rpoB gene sequencing as a suitable supplement to DNA-DNA hybridization for bacterial species and genus delineation. Int J Syst Evol Microbiol. 2008;58:1807–1814. - PubMed
    1. Avaniss-Aghajani E, Jones K, Chapman D, Brunk C.1994A molecular technique for identification of bacteria using small subunit ribosomal RNA sequences Biotechniques 17144–146.148–149. - PubMed
    1. Backhed F, Ley RE, Sonnenburg JL, Peterson DA, Gordon JI. Host-bacterial mutualism in the human intestine. Science. 2005;307:1915–1920. - PubMed
    1. Barman M, Unold D, Shifley K, Amir E, Hung K, Bos N, et al. Enteric salmonellosis disrupts the microbial ecology of the murine gastrointestinal tract. Infect Immun. 2008;76:907–915. - PMC - PubMed
    1. Boye M, Aalbaek B, Agerholm JS. Fusobacterium necrophorum determined as abortifacient in sheep by laser capture microdissection and fluorescence in situ hybridization. Mol Cell Probes. 2006;20:330–336. - PubMed

Publication types