

Ablation of the locus coeruleus increases oxidative stress in tg-2576 transgenic but not wild-type mice
- PMID: 20981353
- PMCID: PMC2958341
- DOI: 10.4061/2010/864625
Ablation of the locus coeruleus increases oxidative stress in tg-2576 transgenic but not wild-type mice
Abstract
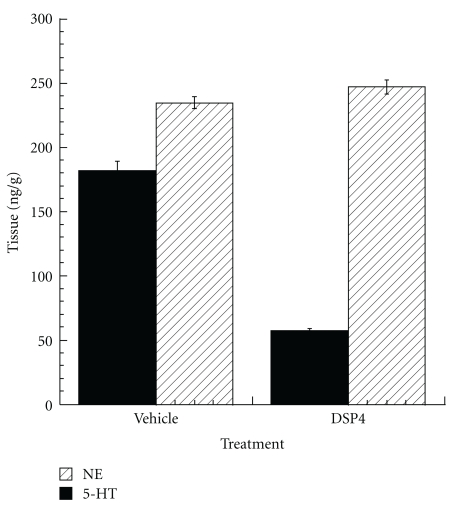
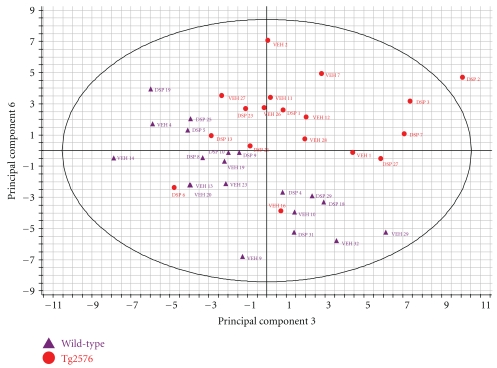
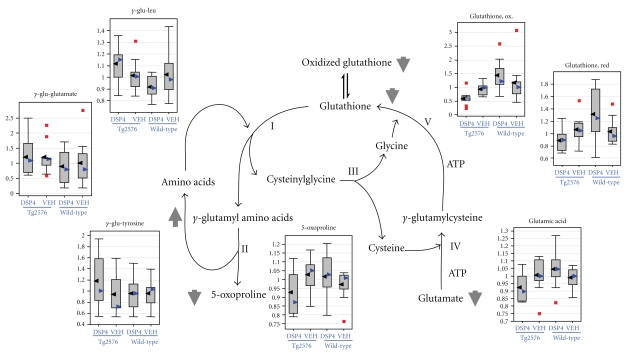
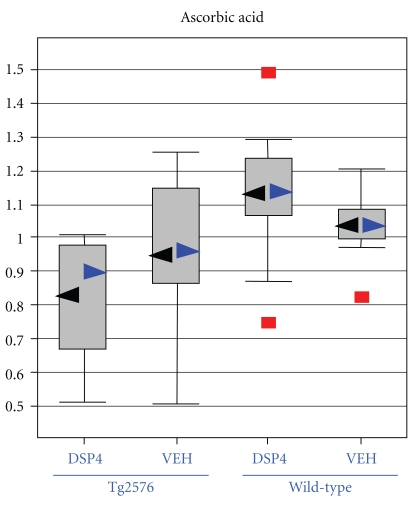
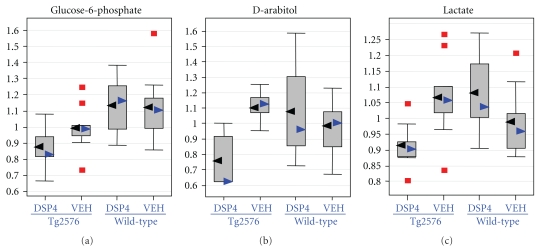
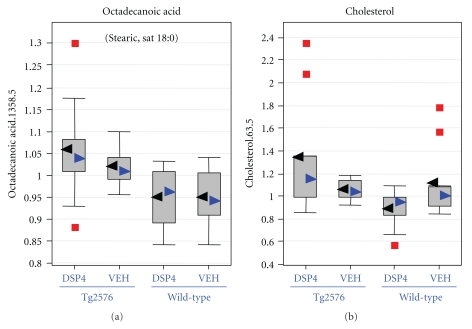
Mice transgenic for production of excessive or mutant forms of beta-amyloid differ from patients with Alzheimer's disease in the degree of inflammation, oxidative damage, and alteration of intermediary metabolism, as well as the paucity or absence of neuronal atrophy and cognitive impairment. Previous observers have suggested that differences in inflammatory response reflect a discrepancy in the state of the locus coeruleus (LC), loss of which is an early change in Alzheimer's disease but which is preserved in the transgenic mice. In this paper, we extend these observations by examining the effects of the LC on markers of oxidative stress and intermediary metabolism. We compare four groups: wild-type or Tg2576 Aβ transgenic mice injected with DSP4 or vehicle. Of greatest interest were metabolites different between ablated and intact transgenics, but not between ablated and intact wild-type animals. The Tg2576_DSP4 mice were distinguished from the other three groups by oxidative stress and altered energy metabolism. These observations provide further support for the hypothesis that Tg2576 Aβ transgenic mice with this ablation may be a more congruent model of Alzheimer's disease than are transgenics with an intact LC.
Figures
Similar articles
-
Mitochondria are a direct site of A beta accumulation in Alzheimer's disease neurons: implications for free radical generation and oxidative damage in disease progression.Hum Mol Genet. 2006 May 1;15(9):1437-49. doi: 10.1093/hmg/ddl066. Epub 2006 Mar 21. Hum Mol Genet. 2006. PMID: 16551656
-
Neutralization of granulocyte macrophage colony-stimulating factor decreases amyloid beta 1-42 and suppresses microglial activity in a transgenic mouse model of Alzheimer's disease.Hum Mol Genet. 2009 Oct 15;18(20):3876-93. doi: 10.1093/hmg/ddp331. Epub 2009 Jul 19. Hum Mol Genet. 2009. PMID: 19617638 Free PMC article.
-
Locus Coeruleus Ablation Exacerbates Cognitive Deficits, Neuropathology, and Lethality in P301S Tau Transgenic Mice.J Neurosci. 2018 Jan 3;38(1):74-92. doi: 10.1523/JNEUROSCI.1483-17.2017. Epub 2017 Nov 13. J Neurosci. 2018. PMID: 29133432 Free PMC article.
-
Beneficial Effects of Walnuts on Cognition and Brain Health.Nutrients. 2020 Feb 20;12(2):550. doi: 10.3390/nu12020550. Nutrients. 2020. PMID: 32093220 Free PMC article. Review.
-
Causes, consequences, and cures for neuroinflammation mediated via the locus coeruleus: noradrenergic signaling system.J Neurochem. 2016 Oct;139 Suppl 2:154-178. doi: 10.1111/jnc.13447. Epub 2016 Mar 10. J Neurochem. 2016. PMID: 26968403 Review.
Cited by
-
Relationships between Mitochondrial Dysfunction and Neurotransmission Failure in Alzheimer's Disease.Aging Dis. 2020 Oct 1;11(5):1291-1316. doi: 10.14336/AD.2019.1125. eCollection 2020 Oct. Aging Dis. 2020. PMID: 33014538 Free PMC article. Review.
-
Ear2 deletion causes early memory and learning deficits in APP/PS1 mice.J Neurosci. 2014 Jun 25;34(26):8845-54. doi: 10.1523/JNEUROSCI.4027-13.2014. J Neurosci. 2014. PMID: 24966384 Free PMC article.
-
Selective loss of noradrenaline exacerbates early cognitive dysfunction and synaptic deficits in APP/PS1 mice.Biol Psychiatry. 2013 Mar 1;73(5):454-63. doi: 10.1016/j.biopsych.2012.06.013. Epub 2012 Aug 9. Biol Psychiatry. 2013. PMID: 22883210 Free PMC article.
-
Redox Signaling in Neurotransmission and Cognition During Aging.Antioxid Redox Signal. 2018 Jun 20;28(18):1724-1745. doi: 10.1089/ars.2017.7111. Epub 2017 May 31. Antioxid Redox Signal. 2018. PMID: 28467718 Free PMC article. Review.
References
-
- Hsiao K, Chapman P, Nilsen S, et al. Correlative memory deficits, Aβ elevation, and amyloid plaques in transgenic mice. Science. 1996;274(5284):99–102. - PubMed
-
- Cai X-D, Golde TE, Younkin SG. Release of excess amyloid β protein from a mutant amyloid β protein precursor. Science. 1993;259(5094):514–516. - PubMed
-
- Cai X-D, Golde TE, Younkin SG. Release of excess amyloid β protein from a mutant amyloid β protein precursor. Science. 1993;259(5094):514–516. - PubMed
-
- Hsiao K, Chapman P, Nilsen S, et al. Correlative memory deficits, Aβ elevation, and amyloid plaques in transgenic mice. Science. 1996;274(5284):99–102. - PubMed
-
- Riley KP, Snowdon DA, Desrosiers MF, Markesbery WR. Early life linguistic ability, late life cognitive function, and neuropathology: findings from the Nun Study. Neurobiology of Aging. 2005;26(3):341–347. - PubMed
LinkOut - more resources
Full Text Sources
Miscellaneous
