Receptacle model of salting-in by tetramethylammonium ions
- PMID: 21028768
- PMCID: PMC3004097
- DOI: 10.1021/jp108052r
Receptacle model of salting-in by tetramethylammonium ions
Abstract
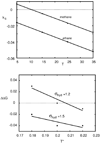
Water is a poor solvent for nonpolar solutes. Water containing ions is an even poorer solvent. According to standard terminology, the tendency of salts to precipitate oils from water is called salting-out. However, interestingly, some salt ions, such as tetramethylammonium (TMA), cause instead the salting-in of hydrophobic solutes. Even more puzzling, there is a systematic dependence on solute size. TMA causes the salting-out of small hydrophobes and the salting-in of larger nonpolar solutes. We study these effects using NPT Monte Carlo simulations of the Mercedes-Benz (MB) + dipole model of water, which was previously shown to account for hydrophobic effects and ion solubilities in water. The present model gives a structural interpretation for the thermodynamics of salting-in. The TMA structure allows deep penetration by a first shell of waters, the dipoles of which interact electrostatically with the ion. This first water shell sets up a second water shell that is shaped to act as a receptacle that binds the nonpolar solute. In this way, a nonpolar solute can actually bind more tightly to the TMA ion than to another hydrophobe, leading to the increased solubility and salting-in. Such structuring may also explain why molecular ions do not follow the same charge density series as atomic ions do.
Figures


Similar articles
-
Effects of salt or cosolvent addition on solubility of a hydrophobic solute in water: Relevance to those on thermal stability of a protein.J Chem Phys. 2017 Feb 7;146(5):055102. doi: 10.1063/1.4975165. J Chem Phys. 2017. PMID: 28178788
-
Hydration patterns and salting effects in sodium chloride solution.J Chem Phys. 2011 Oct 7;135(13):134502. doi: 10.1063/1.3641825. J Chem Phys. 2011. PMID: 21992319
-
How ions affect the structure of water.J Am Chem Soc. 2002 Oct 16;124(41):12302-11. doi: 10.1021/ja026014h. J Am Chem Soc. 2002. PMID: 12371874 Free PMC article.
-
Ionic volumes in solution.Biophys Chem. 2006 Dec 1;124(3):200-7. doi: 10.1016/j.bpc.2006.04.013. Epub 2006 May 3. Biophys Chem. 2006. PMID: 16793195 Review.
-
The hydrophobic effect. 2. Relative importance of the hydrophobic effect on the solubility of hydrophobes and pharmaceuticals in H-bonded solvents.J Pharm Sci. 1998 Aug;87(8):998-1014. doi: 10.1021/js9702980. J Pharm Sci. 1998. PMID: 9687345 Review.
Cited by
-
Hydrophobic hydration of poly-N-isopropyl acrylamide: a matter of the mean energetic state of water.Sci Rep. 2014 Mar 14;4:4377. doi: 10.1038/srep04377. Sci Rep. 2014. PMID: 24625553 Free PMC article.
References
-
- Ben-Naim A. J. Phys. Chem. 1965;69:3250–3253.
-
- Wen-Hui X, Jing-Zhe S, Xi-Ming X. J. Thermochim. Acta. 1990;169:271–286.
-
- McDevit WF, Long FA. J. Am. Chem. Soc. 1952;74:1773–1777.
-
- Hofmeister F. Arch. Exp. Pathol. Pharmakol. 1888;24:247–260.
-
- Kunz W, Henle J, Ninham BW. Curr. Opin. Coll Int. Sci. 2004;9:19–37.
Publication types
MeSH terms
Substances
Grants and funding
LinkOut - more resources
Full Text Sources
Miscellaneous

