

The energetic pathway to mobility loss: an emerging new framework for longitudinal studies on aging
- PMID: 21029063
- PMCID: PMC3057770
- DOI: 10.1111/j.1532-5415.2010.02913.x
The energetic pathway to mobility loss: an emerging new framework for longitudinal studies on aging
Abstract
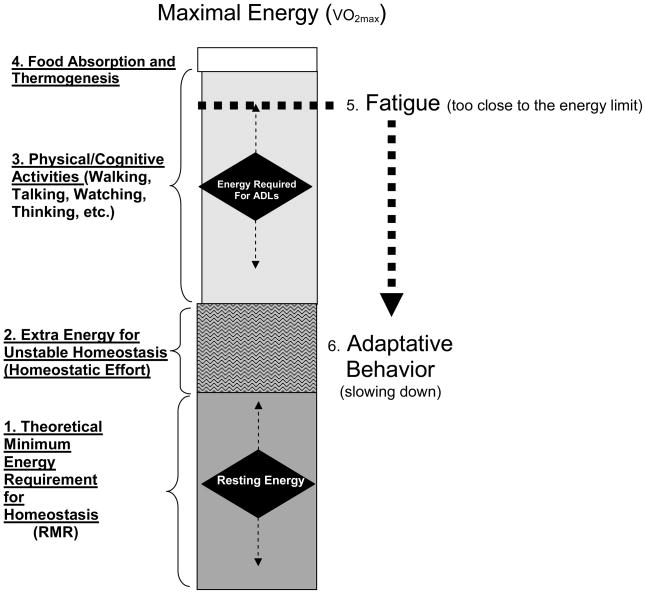
The capacity to walk independently is a central component of independent living. Numerous large and well-designed longitudinal studies have shown that gait speed, a reliable marker of mobility, tends to decline with age and as a consequence of chronic disease. This decline in performance is of utmost importance because slow walking speed is a strong, independent predictor of disability, healthcare utilization, nursing home admission, and mortality. Based on these robust findings, it has been postulated that age-associated decline in walking speed is a reliable barometer of the effect of biological aging on health and functional status. Despite the extraordinary prognostic information that walking speed provides, which is often superior to traditional medical information, there is a limited understanding of the mechanisms that underlie age- and disease-related gait speed decline. Identifying the mechanisms that underlie the prognostic value of walking speed should be a central theme in the design of the next generation of longitudinal studies of aging, with appropriate measures introduced and analytical approaches incorporated. This study hypothesized that a scarcity of available energy induces the decline in customary walking speed with aging and disease. Based on work in the Baltimore Longitudinal Study of Aging, examples of measures, operationalized dimensions, and analytical models that may be implemented to address this are provided. The main premise is simple: the biochemical processes that maintain life, secure homeostatic equilibrium, and prevent the collapse of health require energy. If energy becomes deficient, adaptive behaviors develop to conserve energy.
© 2010, Copyright the Authors. Journal compilation © 2010, The American Geriatrics Society.
Conflict of interest statement
Data for these analyses were obtained from the Baltimore Longitudinal Study of Aging, a study performed by the National Institute on Aging.
Figures
References
-
- Chiang JT, Steciuk M, Shtonda B, et al. Evolution of pharyngeal behaviors and neuronal functions in free-living soil nematodes. J Exp Biol. 2006;209:1859–1873. - PubMed
-
- Wax TM, Goodrick CL. Nearness to death and wheelrunning behavior in mice. Exp Gerontol. 1978;13:233–236. - PubMed
-
- Carter CS, Sonntag WE, Onder G, Pahor M. Physical Performance and Longevity in Aged Rats. 2002;57:B193–197. - PubMed
-
- Priede IG. Natural selection for energetic efficiency and the relationship between activity level and mortality. Nature. 1977;267:610–611. - PubMed
-
- Priede IG. Fish Energetics: New Perspectives. Baltimore: The Johns Hopkins University Press; 1985. pp. 33–66.
Publication types
MeSH terms
Grants and funding
LinkOut - more resources
Full Text Sources
Medical
