. 2011 May;21(3):279-97.
doi: 10.1111/j.1750-3639.2010.00445.x. Epub 2010 Nov 3.

Neuronal MCP-1 mediates microglia recruitment and neurodegeneration induced by the mild impairment of oxidative metabolism

Affiliations

Neuronal MCP-1 mediates microglia recruitment and neurodegeneration induced by the mild impairment of oxidative metabolism

Guang Yang et al. Brain Pathol. 2011 May.

Abstract

Chemokines are implicated in the neuroinflammation of several chronic neurodegenerative disorders. However, the precise role of chemokines in neurodegeneration is unknown. Thiamine deficiency (TD) causes abnormal oxidative metabolism in the brain as well as a well-defined microglia activation and neurodegeneration in the submedial thalamus nucleus (SmTN), which are common features of neurodegenerative diseases. We evaluated the role of chemokines in neurodegeneration and the underlying mechanism in a TD model. Among the chemokines examined, TD selectively induced neuronal expression of monocyte chemoattractant protein-1 (MCP-1) in the SmTN prior to microglia activation and neurodegeneration. The conditioned medium collected from TD-induced neurons caused microglia activation. With a neuron/microglia co-culture system, we showed that MCP-1-induced neurotoxicity required the presence of microglia, and exogenous MCP-1 was able to activate microglia and stimulated microglia to produce cytokines. A MCP-1 neutralizing antibody inhibited MCP-1-induced microglia activation and neuronal death in culture and in the thalamus. MCP-1 knockout mice were resistant to TD-induced neuronal death in SmTN. TD selectively induced the accumulation of reactive oxygen species in neurons, and antioxidants blocked TD-induced MCP-1 expression. Together, our results indicated an induction of neuronal MCP-1 during mild impairment of oxidative metabolism caused by microglia recruitment/activation, which exacerbated neurodegeneration.


Figures

Figure 1
Figure 1
The induction of MCP‐1 in the thalamus by thiamine deficiency (TD). A. TD was induced in C57BL/6J mice as described under the Materials and Methods. The expression of MCP‐1 mRNA in the thalamus and the cerebral cortex was measured by quantitative RT‐PCR analysis after the indicated days of TD. B. The expression of MCP‐1 protein was measured by immunoblotting analysis (left panel). The relative amount of MCP‐1 was quantified and normalized to the expression of GAPDH (right panel). C. Expression of other chemokines in the thalamus and the cerebral cortex was determined by quantitative RT‐PCR analysis. Data were presented as means ± SD (n = 5 for each group); *P < 0.05 (compared with the control group, Ct). Abbreviations: mRNA = messenger RNA; MCP‐1 = monocyte chemoattractant protein‐1; GAPDH = glyceraldehyde‐3‐phosphate dehydrogenase; CCL = chemkine C‐C motif ligand; TNF‐α = tumor necrosis factor α; IL = interleukin; RT‐PCR = real time–polymerase chain reaction; SD = standard deviation.
Figure 2
Figure 2
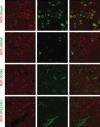
Neuronal expression of MCP‐1 in the thalamus. After 8 days of TD, the expression and localization of MCP‐1 in the thalamus were examined with immunofluorescent staining. The microphotographs show MCP‐1‐positive cells in the submedial thalamus nucleus (SmTN) of the thalamus. The cells in the SmTN were double stained with markers for neurons (NeuN), astrocytes (GFAP), microglia (CD68) and endothelial cells (PECAM1). MCP‐1 was expressed in NeuN‐positive cells in the SmTN. Scale bar = 10 µm. Abbreviations: MCP‐1 = monocyte chemoattractant protein‐1; NeuN = neuronal specific nuclear protein; GFAP = glial fibrillary acidic protein; CD68 = cluster of differentiation 68; PECAM1 = platelet/endothelial cell adhesion molecule‐1.
Figure 3
Figure 3
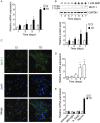
In vitro induction of MCP‐1 in neuronal cells by TD. A. TD was induced in primary cortical neurons as described under the Materials and Methods. The expression of MCP‐1 mRNA was measured by quantitative RT‐PCR analysis. B. The expression of MCP‐1 protein was measured by immunoblotting analysis (top panel), and quantified and normalized to the expression of GAPDH (bottom panel). C. Immunofluorescent images show MCP‐1 staining in primary cortical neurons after 7 days of TD. The nuclei of neurons were stained with DAPI. Scale bar = 10 µm. D. TD was induced in SH‐SY5Y neuroblastoma cells as described under the Materials and Methods. The expression of MCP‐1 mRNA was measured by quantitative RT‐PCR analysis. E. After 7 days of TD, the expression of MCP‐1 mRNA in astrocytes, microglia, b.End3 cells and cortical neurons was measured by quantitative RT‐PCR analysis. Data were presented as means ± SD (n = 3); *P < 0.05 (compared with the control group, Ct). RT‐PCR = real time ‐ polymerase chain reaction; mRNA = messenger RNA; TD = thiamine deficiency; AMP = amprolium; MCP‐1 = monocyte chemoattractant protein‐1; GAPDH = glyceraldehyde‐3‐phosphate dehydrogenase; DAPI = 4′,6‐diamidino‐2‐phenylindole; SH‐SY5Y = a human neuroblastoma cell line; SD = standard deviation.
Figure 4
Figure 4
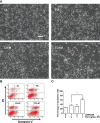
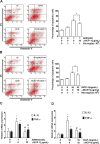
TD‐induced neuronal death in the co‐cultures of neurons and microglia. Primary neurons (1 × 106) were co‐cultured with or without microglia (1 × 106) as described under the Materials and Methods. TD was induced by the treatment with amprolium (AMP; 1 mmol/L) as described under the Materials and Methods. A. Microphotographs show images of neuronal cultures in neuron/microglia co‐cultures after 7 days of TD. TD in the presence of microglia (TD + M) induced the greatest loss of neurons. Scale bar = 50 µm. B. Apoptosis after 7 days of TD was measured by annexin V/PI staining as described under the Materials and Methods. C. The percentage of apoptotic cells determined by annexin V/PI staining was calculated. The results were means ± SD (n = 3); *P< 0.05 (compared with the control group, Ct). Abbreviations: TD = thiamine deficiency; PI = propidium iodide; SD = standard deviation.
Figure 5
Figure 5
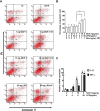
The effect of MCP‐1 on the survival of neurons co‐cultured with microglia. Neuron/microglia co‐cultures were treated with MCP‐1 (1 or 10 ng/mL) or lipopolysaccharide (LPS; 50 ng/mL) for 2 days. A. Apoptotic cell death was measured by annexin V/PI staining. B. The percentage of apoptotic cells determined by annexin V/PI staining was calculated. C. The expression of IL‐1β and TNF‐α mRNA in microglia was measured by quantitative RT‐PCR analysis. The results were means ± SD (n = 3); *P < 0.05 (compared with the control group, Ct). Abbreviations: MCP‐1 = monocyte chemoattractant protein‐1; PI = propidium iodide; IL = interleukin; TNF‐α = tumor necrosis factor α; RT‐PCR = real time ‐ polymerase chain reaction; SD = standard deviation.
Figure 6
Figure 6
The effect of a MCP‐1 neutralizing antibody on TD‐ and MCP‐1‐induced neuronal death. A. TD was induced in neuron/microglia co‐cultures in the presence of a MCP‐1 neutralizing antibody (αMCP‐1, 0 or 10 µg/mL) for 7 days. Apoptotic cell death was measured by annexin V/PI staining (left panel). The percentage of apoptotic cells determined by annexin V/PI staining is presented on the right panel. The results were means ± SD (n = 3); *P < 0.05 (compared with the TD group without αMCP‐1). B. Neuron/microglia co‐cultures were treated with MCP‐1 in the presence of αMCP‐1 (0 or 10 µg/mL) for 2 days. Apoptotic cell death was measured by annexin V/PI staining (left panel). The percentage of apoptotic cells determined by annexin V/PI staining is presented on the right panel. The results were means ± SD (n = 3); *P < 0.05 (compared with the MCP‐1‐treated group without αMCP‐1). C. and D. The effect of αMCP‐1 on TD‐ and MCP‐1‐induced expression of IL‐1β and TNF‐α mRNA in microglia was measured by quantitative RT‐PCR analysis. The results were means ± SD (n = 3); *P < 0.05 (compared with the control group, Ct); #P < 0.05 (compared with TD‐ or MCP‐1‐treated groups without αMCP‐1). Abbreviations: TD = thiamine deficiency; MCP‐1 = monocyte chemoattractant protein‐1; AMP = amprolium; IL = interleukin; TNF‐α = tumor necrosis factor α; mRNA = messenger RNA; PI = propidium iodide; RT‐PCR = real time ‐ polymerase chain reaction; SD = standard deviation.
Figure 7
Figure 7
MCP‐1‐induced microglia activation. A. Microglia were treated with MCP‐1 (0, 1 or 10 ng/mL) or lipopolysaccharide (LPS; 0 or 50 ng/mL) for 3 h. The images show the morphology of microglia before and after the treatment of MCP‐1 or LPS. MCP‐1 and LPS induced the morphology of activated microglia with a large round cell body, compared with the resting microglia with an elongated cell body and branched processes. Scale bar = 20 µm. B. The percentage of active microglia was scored as described under the Materials and Methods. The results were means ± SD (n = 3); *P < 0.05 (compared with the untreated group). C. Microglia were treated with MCP‐1 (0 or 10 ng/mL) or LPS (0 or 50 ng/mL) for 24 h. The expression of IL‐1β and TNF‐α mRNA was measured by quantitative RT‐PCR analysis. The results were means ± SD (n = 3); *P < 0.05 (compared with the untreated group). D. Microglia were incubated with fresh medium; the conditioned medium was collected from control neuronal cultures or the conditioned medium was collected from TD neuronal cultures in the presence of a MCP‐1 neutralizing antibody (αMCP‐1, 0 or 10 µg/mL) for 4 h. The microphotographs show the morphology of the microglia after the treatment. NT: Microglia were not exposed to the conditioned medium. Scale bar = 20 µm. E. The percentage of active microglia was scored. The results were means ± SD (n = 3); *P < 0.05 (compared with the untreated group); #P < 0.05 (compared with the TD group without αMCP‐1). F. Microglia were treated with the conditioned medium collected from TD neuronal cultures in the presence of αMCP‐1 (0 or 10 µg/mL) for 24 h. The expression of IL‐1β and TNF‐α mRNA was measured by quantitative RT‐PCR analysis. The results were means ± SD (n = 3); *P < 0.05 (compared with the untreated group). #P < 0.05 (compared with the TD group without αMCP‐1). Abbreviations: MCP‐1 = monocyte chemoattractant protein‐1; IL = interleukin; TNF‐α = tumor necrosis factor α; RT‐PCR = real time‐polymerase chain reaction; SD = standard deviation.
Figure 8
Figure 8
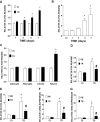
The role of ROS in TD‐mediated MCP‐1 expression in neuronal cells. TD was induced in cultured cortical neurons and SH‐SY5Y neuroblastoma cells as described under the Materials and Methods. A. and B. Intracellular ROS production in cortical neurons and SH‐SY5Y cells was determined by DC‐FDA readings at the indicated time points after TD. C. Intracellular ROS production in primary cortical neurons, astrocytes, microglia and b.End3 cells was determined by DCF‐DA readings after 7 days of TD. The results were means ± SD (n = 3). *P < 0.05 (compared with the control groups). D. and E. TD was induced in cortical neurons and SH‐SY5Y cells in the presence of Trolox (TR, 200 µmol/L) or phosphate buffer (PB). Intracellular ROS production in cortical neurons and SH‐SY5Y cells was determined by DCF‐DA readings after 7 days of TD. F. and G. The relative expression of MCP‐1 mRNA in cortical neurons and SH‐SY5Y neuroblastoma cells was determined after 7 days of TD. The results were means ± SD (n = 3); *P < 0.05 (compared with the untreated group); #P < 0.05 (compared with the TD group without TR). Abbreviations: ROS = reactive oxygen species; SH‐SY5Y = a human neuroblastoma cell line; DC‐FDA = 5‐(and‐6)‐chloromethyl‐2′, 7′‐dichlorodihydrofluorescein diacetate acetyl ester; Ct = control group; TD = thiamine deficiency; mRNA = messenger RNA; SD = standard deviation.
Figure 9
Figure 9
The role of ROS and microglia in TD‐induced neuronal death. TD was induced in neuron/microglia co‐cultures in the presence of Trolox (0 or 200 µmol/L) for 7 days. A. Apoptotic cell death in neurons was measured by annexin V/PI staining as described under the Materials and Methods. M: The presence of microglia. B. The percentage of apoptotic neurons was calculated. C. The expression of IL‐1β and TNF‐α mRNA in microglia was measured by quantitative RT‐PCR analysis. The results were means ± SD (n = 3); *P < 0.05 (compared with the control groups); #P < 0.05 (compared with the TD groups without Trolox). Abbreviations: ROS = reactive oxygen species; RT‐PCR = real time–polymerase chain reaction; SD = standard deviation; PI = propidium iodide; Ct = control group; TD = thiamine deficiency; AMP = amprolium; mRNA = messenger RNA; IL = interleukin; TNF‐α = tumor necrosis factor α.
Figure 10
Figure 10
The effect of a MCP‐1 neutralizing antibody on TD‐induced microglia recruitment and neuronal death, and in the thalamus. TD was induced in mice as described under the Materials and Methods. On day 7 of TD, PBS or α‐MCP‐1 antibody (4 µg in PBS) was injected to the left SmTN of the thalamus. PBS‐injected mice served as a control. A. and B. On day 9 of TD, mice were sacrificed, and the thalamus was removed for the analysis of IBA1 and NeuN immunohistochemistry. Scale bar = 100 µm. C. and D. Changes of IBA1‐positive microglia and NeuN‐positive neurons in SmTN were quantified by stereological analysis as described under the Materials and Methods. The cell number in the left and right SmTN of mice was presented, separately. Results were presented as means ± SD (n = 7); *P < 0.05 (compared with the groups injected with PBS only). Abbreviations: TD = thiamine deficiency; SmTN = submedial thalamus nucleus; SD = standard deviation; IBA1 = ionized calcium‐binding adaptor molecule‐1; NeuN = neuronal specific nuclear protein; PBS = phosphate buffer saline; mt =  mammillothalamic tract; MCP‐1 = monocyte chemoattractant protein‐1.
Figure 11
Figure 11
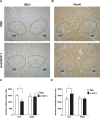
TD‐induced microglia recruitment and neuronal death in MCP‐1 knockout mice and wild‐type mice. TD was induced in MCP‐1 knockout mice (CCL2−/−) and wild‐type mice (CCL2+/+) as described under the Materials and Methods. A. and B. On day 9 of TD, mice were sacrificed, and the thalamus was removed for the analysis of IBA1 and NeuN immunohistochemistry as described above. Scale bar = 100 µm. C. and D. Changes of IBA1‐positive microglia and NeuN‐positive neurons in SmTN were quantified by stereological analysis as described as above. Results were presented as means ± SD (n = 5); *P < 0.05 (between CCL2−/− and CCL2+/+ mice). Abbreviations: TD = thiamine deficiency; MCP‐1 = monocyte chemoattractant protein‐1; SmTN = submedial thalamus nucleus; SD = standard deviation; IBA1 = ionized calcium‐binding adaptor molecule‐1; NeuN = neuronal specific nuclear protein; CCL =  chemokine C‐C motif ligand; mt = mammillothalamic tract.

Similar articles

Cited by

References

    1. Akiyama H, Barger S, Barnum S, Bradt B, Bauer J, Cole GM et al (2000) Inflammation and Alzheimer's disease. Neurobiol Aging 21:383–421. - PMC - PubMed
    1. Allan SM, Rothwell NJ (2001) Cytokines and acute neurodegeneration. Nat Rev Neurosci 2:734–744. - PubMed
    1. Antony JM, van Marle G, Opii W, Butterfield DA, Mallet F, Yong VW et al (2004) Human endogenous retrovirus glycoprotein—mediated induction of redox reactants causes oligodendrocyte death and demyelination. Nat Neurosci 7:1088–1095. - PubMed
    1. Banisadr G, Gosselin RD, Mechighel P, Kitabgi P, Rostene W, Parsadaniantz SM (2005) Highly regionalized neuronal expression of monocyte chemoattractant protein‐1 (MCP‐1/CCL2) in rat brain: evidence for its colocalization with neurotransmitters and neuropeptides. J Comp Neurol 489:275–292. - PubMed
    1. Benveniste EN, Nguyen VT, O'Keefe GM (2001) Immunological aspects of microglia: relevance to Alzheimer's disease. Neurochem Int 39:381–391. - PubMed

Publication types

MeSH terms