. 2011 Feb;24(1):187-96.
doi: 10.1111/j.1755-148X.2010.00788.x. Epub 2010 Nov 10.

Spectral analysis by XANES reveals that GPNMB influences the chemical composition of intact melanosomes

Affiliations

Spectral analysis by XANES reveals that GPNMB influences the chemical composition of intact melanosomes

Tamás Haraszti et al. Pigment Cell Melanoma Res. 2011 Feb.

Abstract

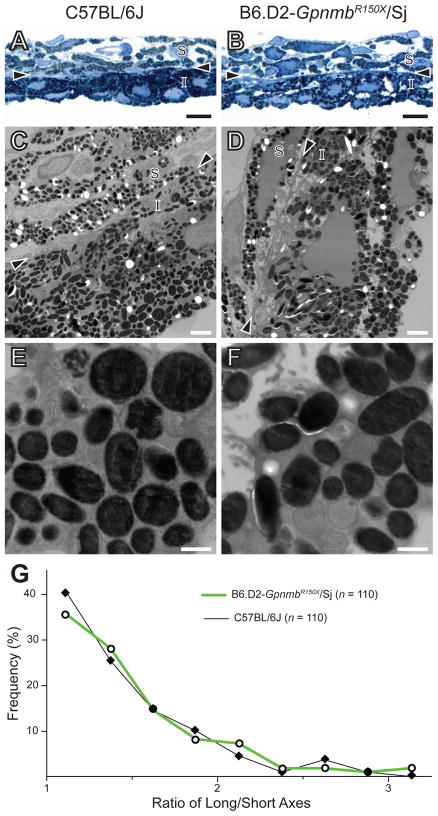
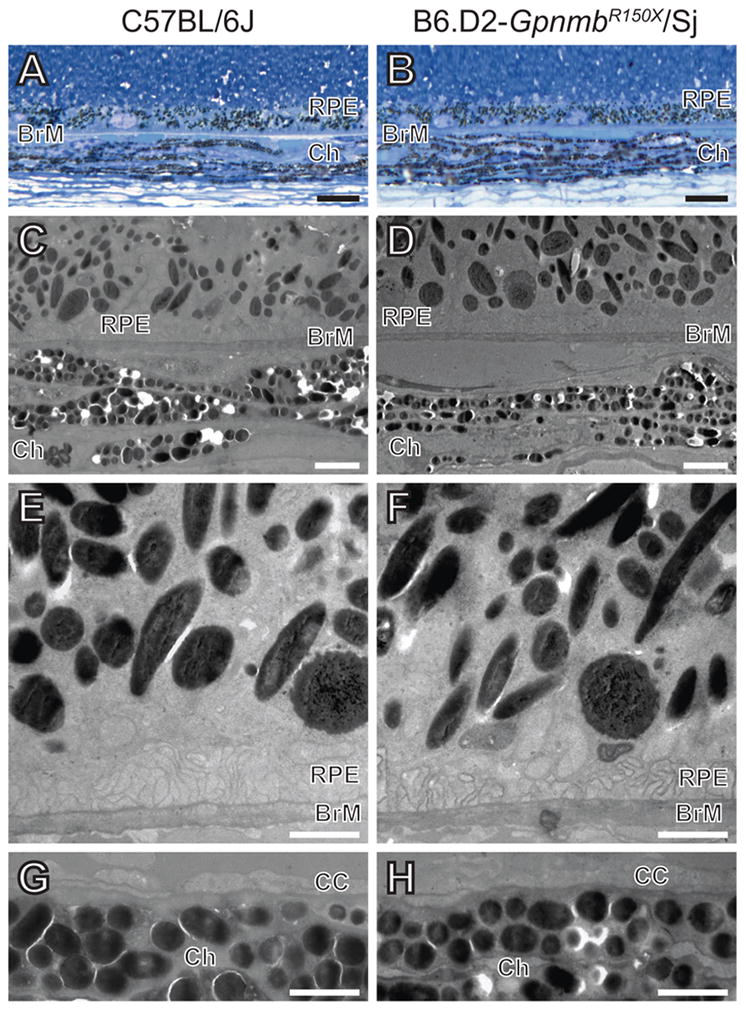
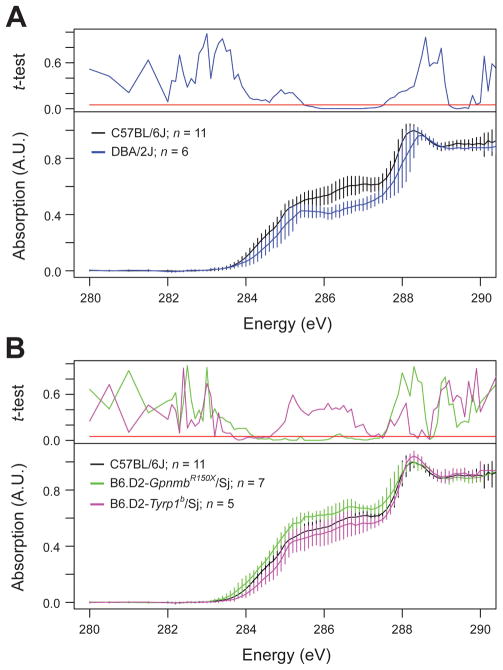
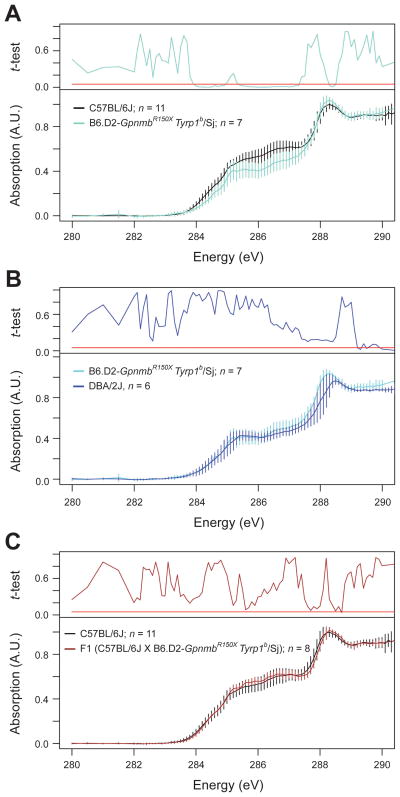
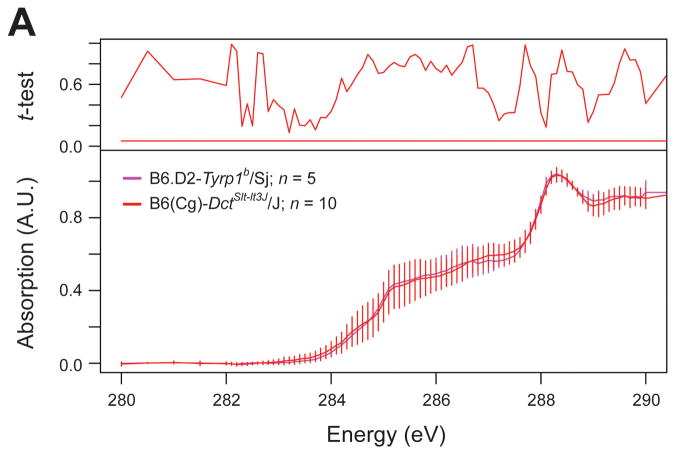
GPNMB is a unique melanosomal protein. Unlike many melanosomal proteins, GPNMB has not been associated with any forms of albinism, and it is unclear whether GPNMB has any direct influence on melanosomes. Here, melanosomes from congenic strains of C57BL/6J mice mutant for Gpnmb are compared to strain-matched controls using standard transmission electron microscopy and synchrotron-based X-ray absorption near-edge structure analysis (XANES). Whereas electron microscopy did not detect any ultrastructural changes in melanosomes lacking functional GPNMB, XANES uncovered multiple spectral phenotypes. These results directly demonstrate that GPNMB influences the chemical composition of melanosomes and more broadly illustrate the potential for using genetic approaches in combination with nano-imaging technologies to study organelle biology.


Figures

Figure 1
Figure 1
Lack of Gpnmb-mutant phenotype detectable by TEM in melanosomes of the iris. (A,B) Light microscopy (scale bar = 10 μm) and (C,D) TEM (scale bar = 2 μm) images showing similarities in the appearance of melanosomes from C57BL/6J (left column) and B6.D2-GpnmbR150X/Sj (right column) irides. (E,F) Higher magnification TEM of iris pigment epithelium (scale bar = 0.5 μm). Arrowheads, border region; S, iris stroma, I, iris pigment epithelium. (G) Shape distribution plot showing that in situ melanosomes of the iris from C57BL/6J and B6.D2-GpnmbR150X/Sj mice share a similar shape.
Figure 2
Figure 2
Lack of Gpnmb-mutant phenotype detectable by TEM in melanosomes of the retinal pigment epithelium and choroid. (A,B) Light microscopy (scale bar = 10 μm) and (C,D) low magnification TEM (scale bar = 2 μm) images showing similar appearance of melanosomes from C57BL/6J (left column) and B6.D2-GpnmbR150X/Sj (right column) tissues. (E,F) Higher magnification TEM of RPE and (G,H) choroid (scale bar = 1 μm). Note that there are no apparent differences in density, distribution, size, shape, or pigmentation of melanosomes from C57BL/6J and B6.D2-GpnmbR150X/Sj mice. BrM, Bruchs membrane; RPE, retinal pigmented epithelium; Ch, choroid; CC, choriocapillaris.
Figure 3
Figure 3
XANES spectra reveal that mutations in both Gpnmb and Tyrp1 contribute to differences between C57BL/6J and DBA/2J melanosomes. (A) Strain-dependent spectral difference exhibited by melanosomes of C57BL/6J and DBA/2J mice. (B) Monogenic contributions of Gpnmb and Tyrp1 mutations. Normalized spectra, mean ± 1 standard deviation; Student’s two-tailed t-test (compared to C57BL/6J) with significance set at 0.05 (red bar); n = number of fields analyzed per genotype.
Figure 4
Figure 4
XANES spectra obtained for melanosomes with combined Gpnmb and Tyrp1 mutation identify the basis for spectral differences between melanosomes of C57BL/6J and DBA/2J mice. (A) Significant spectral changes at 284–285 eV and 285–287 eV. (B) Recapitulation of DBA/2J spectral phenotypes in melanosomes from B6.D2-Tyrp1bGpnmbR150X/Sj mice. (C) Lack of phenotype in F1 mice heterozygous for the Tyrp1b and GpnmbR150X mutations. Normalized spectra, mean ± 1 standard deviation; Student’s two-tailed t-test (A & C compared to C57BL/6J; B compared to B6.D2-Tyrp1bGpnmbR150X/Sj) with significance set at 0.05 (red bar); n = number of fields analyzed per genotype.
Figure 5
Figure 5
XANES spectra reveal that melanosomes from mice with Tyrp1 or Dct mutation phenocopy one another. Normalized spectra, mean ± 1 standard deviation; Student’s two-tailed t-test (compared to B6.D2-Tyrp1b/Sj) with significance set at 0.05 (red bar); n = number of fields analyzed per genotype.

References

    1. Abramoff M, Magelhaes P, Ram S. Image Processing with ImageJ. Biophotonics International. 2004;11:36–42.
    1. Anderson MG, Haraszti T, Petersen GE, Wirick S, Jacobsen C, John SW, Grunze M. Scanning transmission X-ray microscopic analysis of purified melanosomes of the mouse iris. Micron. 2006a;37:689–98. - PubMed
    1. Anderson MG, Hawes NL, Trantow CM, Chang B, John SW. Iris phenotypes and pigment dispersion caused by genes influencing pigmentation. Pigment Cell Melanoma Res. 2008a;21:565–78. - PMC - PubMed
    1. Anderson MG, Libby RT, Mao M, Cosma IM, Wilson LA, Smith RS, John SW. Genetic context determines susceptibility to intraocular pressure elevation in a mouse pigmentary glaucoma. BMC Biol. 2006b;4:20. - PMC - PubMed
    1. Anderson MG, Nair KS, Amonoo LA, Mehalow A, Trantow CM, Masli S, John SW. GpnmbR150X allele must be present in bone marrow derived cells to mediate DBA/2J glaucoma. BMC Genet. 2008b;9:30. - PMC - PubMed

Publication types

LinkOut - more resources