. 2010 Oct 28:11:609.
doi: 10.1186/1471-2164-11-609.

Genomic analysis of microRNA time-course expression in liver of mice treated with genotoxic carcinogen N-ethyl-N-nitrosourea

Affiliations

Genomic analysis of microRNA time-course expression in liver of mice treated with genotoxic carcinogen N-ethyl-N-nitrosourea

Zhiguang Li et al. BMC Genomics. .

Abstract

Background: Dysregulated expression of microRNAs (miRNAs) has been previously observed in human cancer tissues and shown promise in defining tumor status. However, there is little information as to if or when expression changes of miRNAs occur in normal tissues after carcinogen exposure.

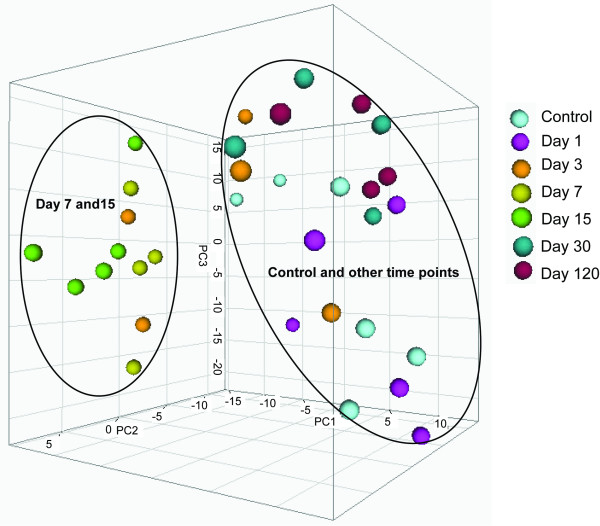
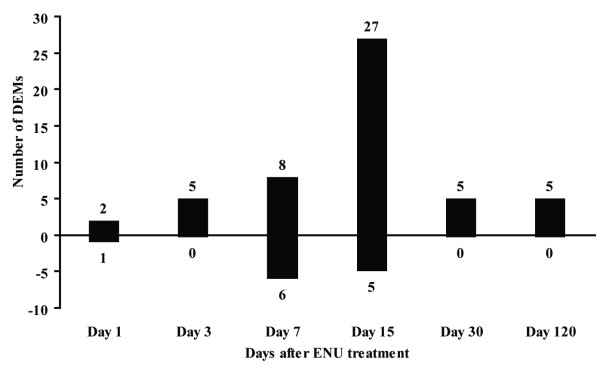
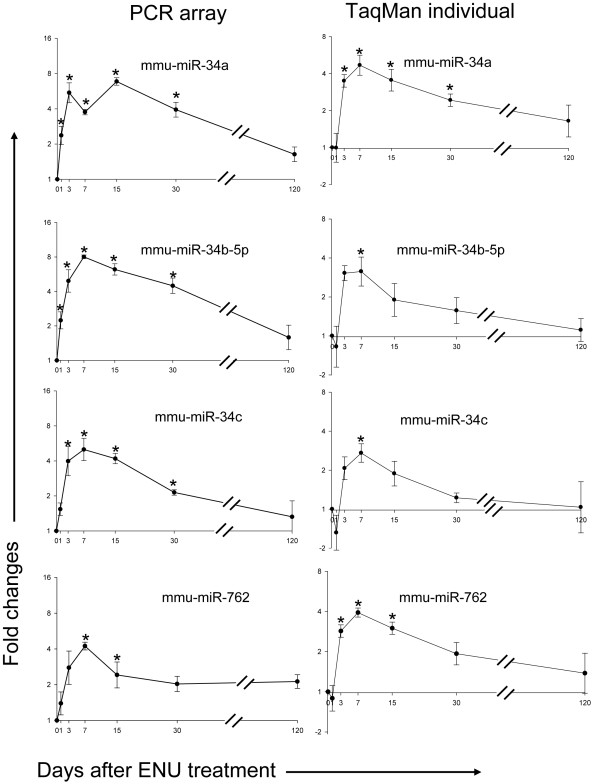
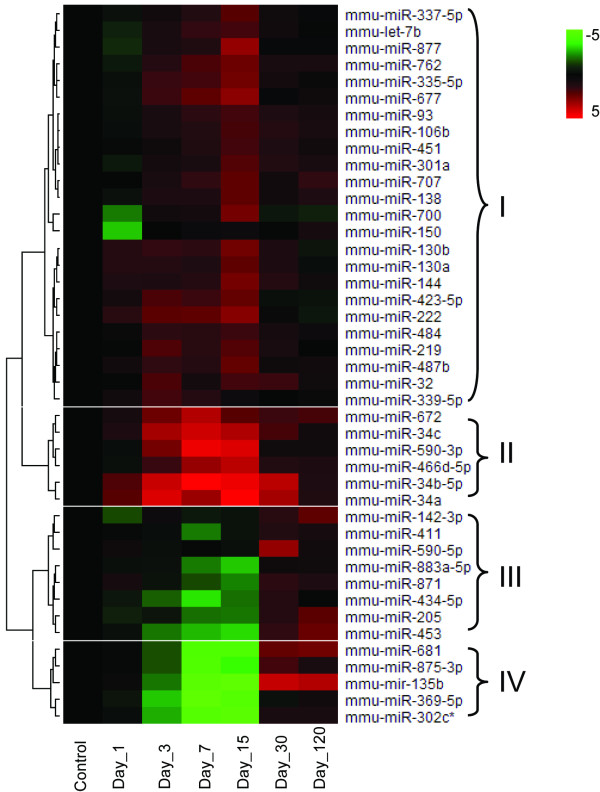
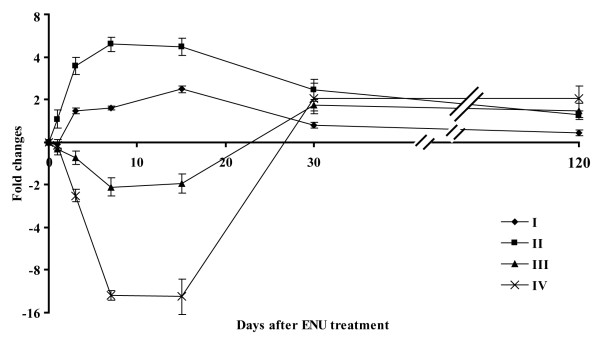
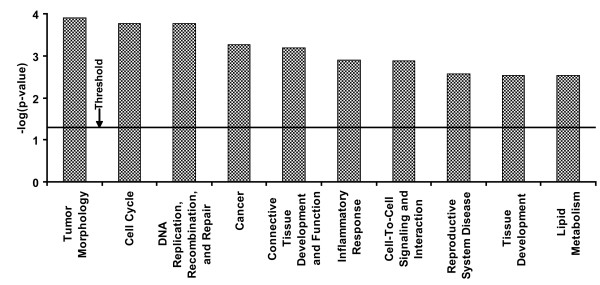
Results: To explore the possible time-course changes of miRNA expression induced by a carcinogen, we treated mice with one dose of 120 mg/kg N-ethyl-N-nitrosourea (ENU), a model genotoxic carcinogen, and vehicle control. The miRNA expression profiles were assessed in the mouse livers in a time-course design. miRNAs were isolated from the livers at days 1, 3, 7, 15, 30 and 120 after the treatment and their expression was determined using a miRNA PCR Array. Principal component analysis of the miRNA expression profiles showed that miRNA expression at post-treatment days (PTDs) 7 and 15 were different from those at the other time points and the control. The number of differentially expressed miRNAs (DEMs) changed over time (3, 5, 14, 32, 5 and 5 at PTDs 1, 3, 7, 15, 30 and 120, respectively). The magnitude of the expression change varied with time with the highest changes at PTDs 7 or 15 for most of the DEMs. In silico functional analysis of the DEMs at PTDs 7 and 15 indicated that the major functions of these ENU-induced DEMs were associated with DNA damage, DNA repair, apoptosis and other processes related to carcinogenesis.

Conclusion: Our results showed that many miRNAs changed their expression to respond the exposure of the genotoxic carcinogen ENU and the number and magnitude of the changes were highest at PTDs 7 to 15. Thus, one to two weeks after the exposure is the best time for miRNA expression sampling.


Figures

Figure 1
Figure 1
Principal component analysis of liver samples collected at different times after ENU treatment. The samples were analyzed according to the expressions of 376 mouse miRNAs using auto-scale method.
Figure 2
Figure 2
Number of the differentially expressed miRNAs (DEMs) in livers of mice treated with ENU at different post-treatment days. The bars above and below x axis represent up- and down- regulated DEMs, respectively. The numbers at the top of each bar denote the amount of DEMs represented by the bar.
Figure 3
Figure 3
The temporal expression changes of three miR-34 family members and one miR-762 family member as determined by PCR arrays and individual TaqMan assays. The data for each time point are the mean of 4 or 5 samples with its standard error. The asterisk indicates there is a significant difference between the treatment and control at that time point (p < 0.01).
Figure 4
Figure 4
Hierarchical clustering analysis of 43 deferentially expressed miRNAs. Fold change for each miRNA at each time point after ENU treatment was determined relative to the vehicle-treated controls and logarithmically transformed (base 2). Hierarchical cluster analysis was conducted using a Euclidean distance-calculating and Ward linking method. Up-regulated miRNAs are shown in red; down-regulated miRNAs in green; and no-changes in black. Four clustering groups were identified and named as I, II, III, and IV, respectively.
Figure 5
Figure 5
Average fold changes of the 4 clustering groups with the different sampling times. The fold changes of all miRNAs in one clustering group were averaged and plotted with its standard errors of the mean against the time points after ENU treatment.
Figure 6
Figure 6
The top 10 biological functions altered by ENU treatment according to the p values. The target genes of the differentially expressed miRNAs at post-treatment days 7 and 15 were computationally predicted by miRanda algorithm. The top 5% predicted genes were utilized for functional analysis using Ingenuity Pathway Analysis system. The threshold (p = 0.05) indicates whether the functions are significantly changed by the treatment or not. If a p value of a function is less than the threshold, the function is considered as significantly changed.

Similar articles

Cited by

References

    1. Ambros V. MicroRNA pathways in flies and worms: growth, death, fat, stress, and timing. Cell. 2003;113(6):673–676. doi: 10.1016/S0092-8674(03)00428-8. - DOI - PubMed
    1. Bartel DP. MicroRNAs: genomics, biogenesis, mechanism, and function. Cell. 2004;116(2):281–297. doi: 10.1016/S0092-8674(04)00045-5. - DOI - PubMed
    1. Shivdasani RA. MicroRNAs: regulators of gene expression and cell differentiation. Blood. 2006;108(12):3646–3653. doi: 10.1182/blood-2006-01-030015. - DOI - PMC - PubMed
    1. Fabbri M, Ivan M, Cimmino A, Negrini M, Calin GA. Regulatory mechanisms of microRNAs involvement in cancer. Expert Opin Biol Ther. 2007;7(7):1009–1019. doi: 10.1517/14712598.7.7.1009. - DOI - PubMed
    1. Cummins JM, Velculescu VE. Implications of micro-RNA profiling for cancer diagnosis. Oncogene. 2006;25(46):6220–6227. doi: 10.1038/sj.onc.1209914. - DOI - PubMed

Publication types

MeSH terms