

A tissue phantom for visualization and measurement of ultrasound-induced cavitation damage
- PMID: 21030142
- PMCID: PMC2997329
- DOI: 10.1016/j.ultrasmedbio.2010.08.023
A tissue phantom for visualization and measurement of ultrasound-induced cavitation damage
Abstract
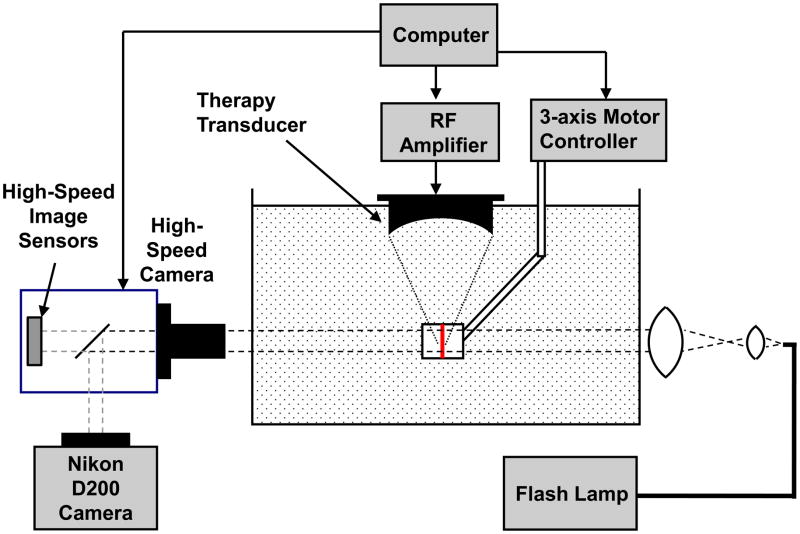
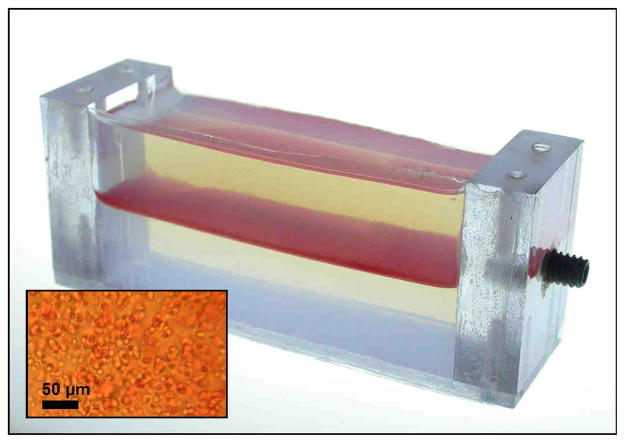
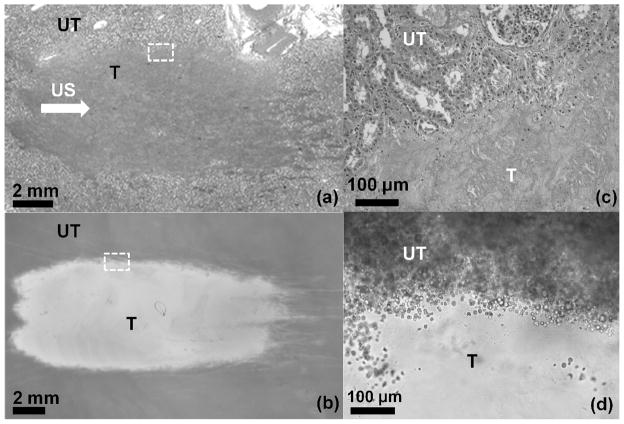
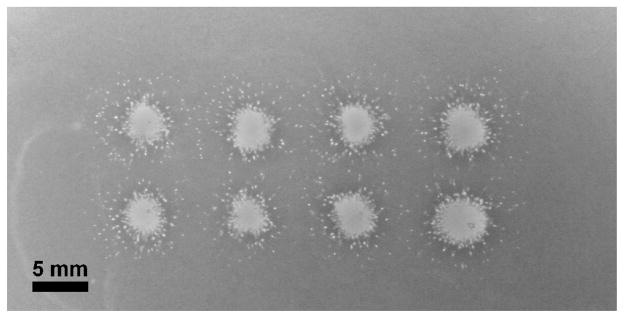
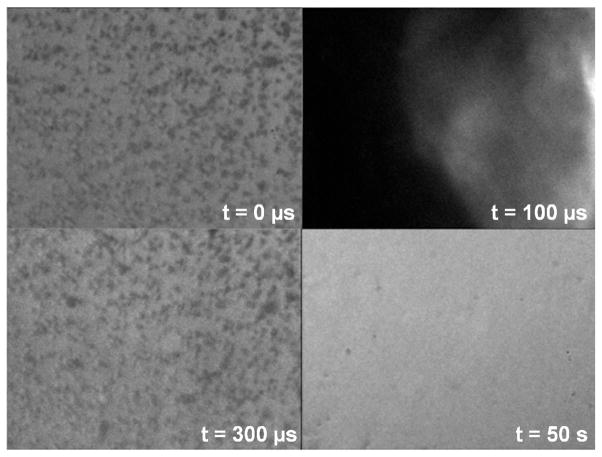
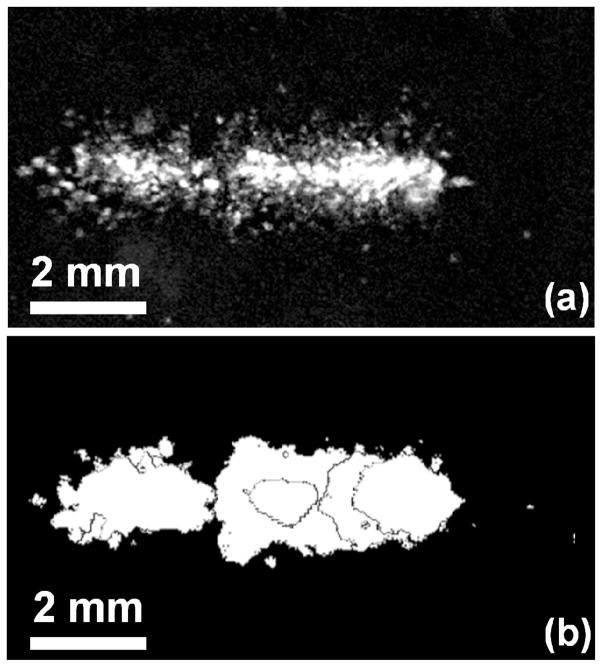
Many ultrasound studies involve the use of tissue-mimicking materials to research phenomena in vitro and predict in vivo bioeffects. We have developed a tissue phantom to study cavitation-induced damage to tissue. The phantom consists of red blood cells suspended in an agarose hydrogel. The acoustic and mechanical properties of the gel phantom were found to be similar to soft tissue properties. The phantom's response to cavitation was evaluated using histotripsy. Histotripsy causes breakdown of tissue structures by the generation of controlled cavitation using short, focused, high-intensity ultrasound pulses. Histotripsy lesions were generated in the phantom and kidney tissue using a spherically focused 1-MHz transducer generating 15 cycle pulses, at a pulse repetition frequency of 100 Hz with a peak negative pressure of 14 MPa. Damage appeared clearly as increased optical transparency of the phantom due to rupture of individual red blood cells. The morphology of lesions generated in the phantom was very similar to that generated in kidney tissue at both macroscopic and cellular levels. Additionally, lesions in the phantom could be visualized as hypoechoic regions on a B-mode ultrasound image, similar to histotripsy lesions in tissue. High-speed imaging of the optically transparent phantom was used to show that damage coincides with the presence of cavitation. These results indicate that the phantom can accurately mimic the response of soft tissue to cavitation and provide a useful tool for studying damage induced by acoustic cavitation.
Copyright © 2010 World Federation for Ultrasound in Medicine & Biology. Published by Elsevier Inc. All rights reserved.
Figures
Similar articles
-
Effects of ultrasound frequency and tissue stiffness on the histotripsy intrinsic threshold for cavitation.Ultrasound Med Biol. 2015 Jun;41(6):1651-67. doi: 10.1016/j.ultrasmedbio.2015.01.028. Epub 2015 Mar 9. Ultrasound Med Biol. 2015. PMID: 25766571 Free PMC article.
-
Development of Tough Hydrogel Phantoms to Mimic Fibrous Tissue for Focused Ultrasound Therapies.Ultrasound Med Biol. 2022 Sep;48(9):1762-1777. doi: 10.1016/j.ultrasmedbio.2022.05.002. Epub 2022 Jun 10. Ultrasound Med Biol. 2022. PMID: 35697582 Free PMC article.
-
Control of the dynamics of a boiling vapour bubble using pressure-modulated high intensity focused ultrasound without the shock scattering effect: A first proof-of-concept study.Ultrason Sonochem. 2021 Sep;77:105699. doi: 10.1016/j.ultsonch.2021.105699. Epub 2021 Jul 31. Ultrason Sonochem. 2021. PMID: 34371476 Free PMC article.
-
The histotripsy spectrum: differences and similarities in techniques and instrumentation.Int J Hyperthermia. 2023;40(1):2233720. doi: 10.1080/02656736.2023.2233720. Int J Hyperthermia. 2023. PMID: 37460101 Free PMC article. Review.
-
Histotripsy: an innovative approach for minimally invasive tumour and disease treatment.Ann Med Surg (Lond). 2024 Mar 5;86(4):2081-2087. doi: 10.1097/MS9.0000000000001897. eCollection 2024 Apr. Ann Med Surg (Lond). 2024. PMID: 38576932 Free PMC article. Review.
Cited by
-
Effect of Frequency-Dependent Attenuation on Predicted Histotripsy Waveforms in Tissue-Mimicking Phantoms.Ultrasound Med Biol. 2016 Jul;42(7):1701-5. doi: 10.1016/j.ultrasmedbio.2016.02.010. Epub 2016 Apr 20. Ultrasound Med Biol. 2016. PMID: 27108036 Free PMC article.
-
Estimating the mechanical energy of histotripsy bubble clouds with high frame rate imaging.Phys Med Biol. 2021 Aug 5;66(16):10.1088/1361-6560/ac155d. doi: 10.1088/1361-6560/ac155d. Phys Med Biol. 2021. PMID: 34271560 Free PMC article.
-
Bubble-Induced Color Doppler Feedback for Histotripsy Tissue Fractionation.IEEE Trans Ultrason Ferroelectr Freq Control. 2016 Mar;63(3):408-19. doi: 10.1109/TUFFC.2016.2525859. Epub 2016 Feb 4. IEEE Trans Ultrason Ferroelectr Freq Control. 2016. PMID: 26863659 Free PMC article.
-
Development of an Injectable Hydrogel for Histotripsy Ablation Toward Future Glioblastoma Therapy Applications.Ann Biomed Eng. 2024 Dec;52(12):3157-3171. doi: 10.1007/s10439-024-03601-1. Epub 2024 Aug 30. Ann Biomed Eng. 2024. PMID: 39210157 Free PMC article.
-
Bubble cloud characteristics and ablation efficiency in dual-frequency intrinsic threshold histotripsy.Phys Med Biol. 2023 Nov 6;68(22):225006. doi: 10.1088/1361-6560/ad00a5. Phys Med Biol. 2023. PMID: 37797649 Free PMC article.
References
-
- Brayman AA, Lizotte LM, Miller MW. Erosion of artificial endothelia in vitro by pulsed ultrasound: acoustic pressure, frequency, membrane orientation and microbubble contrast agent dependence. Ultrasound in Medicine & Biology. 1999;25:1305–20. - PubMed
-
- Brümmer F, Brenner J, Bräuner T, Hülser DF. Effect of shock waves on suspended and immobilized L1210 cells. Ultrasound in Medicine & Biology. 1989;15:229–39. - PubMed
Publication types
MeSH terms
Substances
Grants and funding
LinkOut - more resources
Full Text Sources
Other Literature Sources
