

High-resolution CT for identify patients with smear-positive, active pulmonary tuberculosis
- PMID: 21030177
- PMCID: PMC7127118
- DOI: 10.1016/j.ejrad.2010.09.040
High-resolution CT for identify patients with smear-positive, active pulmonary tuberculosis
Abstract
Purpose: This study evaluates the use of high-resolution computed tomography (HRCT) to differentiate smear-positive, active pulmonary tuberculosis (PTB) from other pulmonary infections in the emergency room (ER) setting.
Methods: One hundred and eighty-three patients diagnosed with pulmonary infections in an ER were divided into an acid fast bacillus (AFB) smear-positive, active PTB group (G1=84) and a non-AFB smear-positive, pulmonary infection group (G2=99). HRCT images from a 64-Multidetector CT were analyzed, retrospectively, for the morphology, number, and segmental distribution of pulmonary lesions.
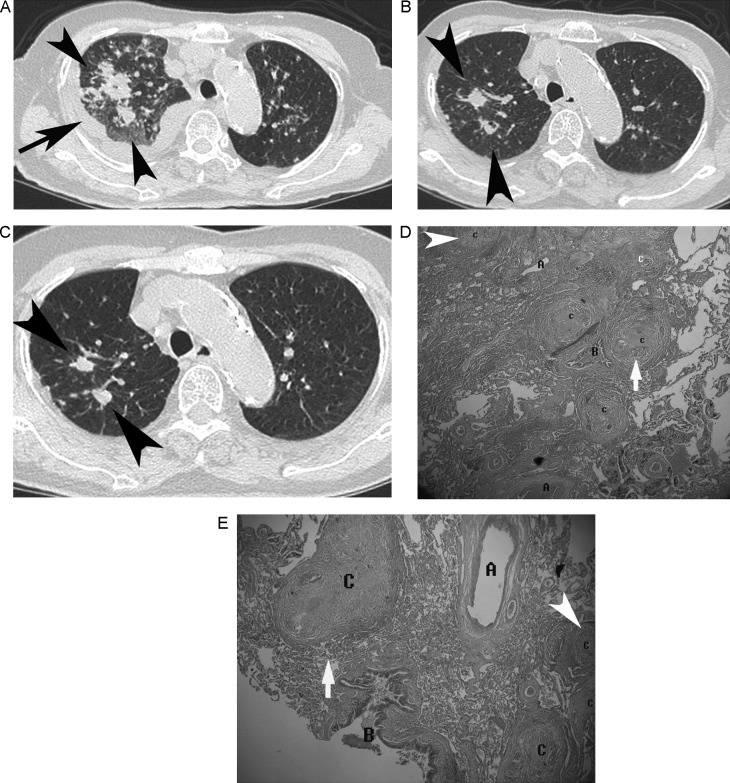
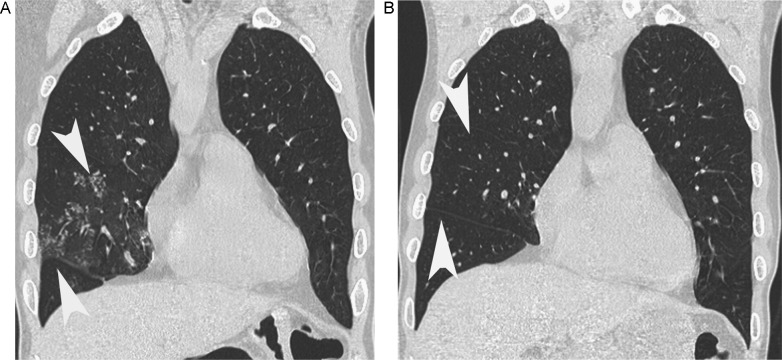
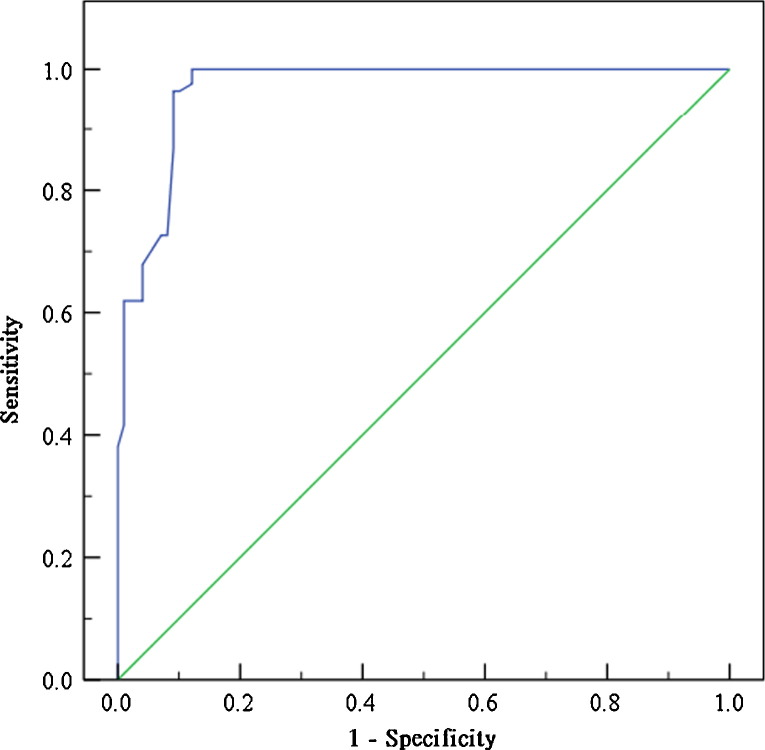
Results: Utilizing multivariate analysis, five variables were found to be independent risk factors predictive of G1: (1) consolidation involving the apex segment of right upper lobe, posterior segment of the right upper lobe, or apico-posterior segment of the left upper lobe; (2) consolidation involving the superior segment of the right or left lower lobe; (3) presence of a cavitary lesion; (4) presence of clusters of nodules; (5) absence of centrilobular nodules. A G1 prediction score was generated based on these 5 criteria to help differentiate G1 from G2. The area under the receiver operating characteristic (ROC) curve was 0.96 ± 0.012 in our prediction model. With an ideal cut-off point score of 3, the specificity, sensitivity, positive predictive value (PPV), and negative predictive value (NPV) are 90.9%, 96.4%, 90.0% and 96.8%, respectively.
Conclusion: The use of this AFB smear-positive, active PTB prediction model based on 5 key HRCT findings may help ER physicians determine whether or not isolation is required while awaiting serial sputum smear results in high risk patients.
Copyright © 2010 Elsevier Ireland Ltd. All rights reserved.
Figures
Similar articles
-
Diagnostic Accuracy of High-Resolution Computed Tomography of Chest in Diagnosing Sputum Smear Positive and Sputum Smear Negative Pulmonary Tuberculosis.Cureus. 2020 Jun 5;12(6):e8467. doi: 10.7759/cureus.8467. Cureus. 2020. PMID: 32642373 Free PMC article.
-
Validation of a model for predicting smear-positive active pulmonary tuberculosis in patients with initial acid-fast bacilli smear-negative sputum.Eur Radiol. 2018 Jan;28(1):243-256. doi: 10.1007/s00330-017-4959-9. Epub 2017 Jul 14. Eur Radiol. 2018. PMID: 28710581
-
A high-resolution computed tomography-based scoring system to differentiate the most infectious active pulmonary tuberculosis from community-acquired pneumonia in elderly and non-elderly patients.Eur Radiol. 2014 Oct;24(10):2372-84. doi: 10.1007/s00330-014-3279-6. Epub 2014 Jun 28. Eur Radiol. 2014. PMID: 24972956
-
High-resolution CT findings in patients with pulmonary tuberculosis: correlation with the degree of smear positivity.J Thorac Imaging. 2007 May;22(2):154-9. doi: 10.1097/01.rti.0000213590.29472.ce. J Thorac Imaging. 2007. PMID: 17527119
-
The Predictive Value of Multidetector High Resolution Computed Tomography in Evaluation of Suspected Sputum Smear Negative Active Pulmonary Tuberculosis in Egyptian Zagazig University Hospital Patients.Pol J Radiol. 2017 Dec 15;82:808-816. doi: 10.12659/PJR.903743. eCollection 2017. Pol J Radiol. 2017. PMID: 29657649 Free PMC article. Review.
Cited by
-
Ultralow-dose CT with knowledge-based iterative model reconstruction (IMR) in evaluation of pulmonary tuberculosis: comparison of radiation dose and image quality.Eur Radiol. 2019 Oct;29(10):5358-5366. doi: 10.1007/s00330-019-06129-4. Epub 2019 Mar 29. Eur Radiol. 2019. PMID: 30927099
-
A high-resolution 3D atlas of the spectrum of tuberculous and COVID-19 lung lesions.EMBO Mol Med. 2022 Nov 8;14(11):e16283. doi: 10.15252/emmm.202216283. Epub 2022 Oct 26. EMBO Mol Med. 2022. PMID: 36285507 Free PMC article.
-
Computed tomography findings in patients with pulmonary tuberculosis and diabetes at an infectious disease hospital in China: a retrospective cross-sectional study.BMC Infect Dis. 2023 Jun 27;23(1):436. doi: 10.1186/s12879-023-08386-7. BMC Infect Dis. 2023. PMID: 37370020 Free PMC article.
-
Diagnostic Accuracy of High-Resolution Computed Tomography of Chest in Diagnosing Sputum Smear Positive and Sputum Smear Negative Pulmonary Tuberculosis.Cureus. 2020 Jun 5;12(6):e8467. doi: 10.7759/cureus.8467. Cureus. 2020. PMID: 32642373 Free PMC article.
-
How radiology can help pulmonary tuberculosis diagnosis: analysis of 49 patients.Radiol Med. 2019 Sep;124(9):838-845. doi: 10.1007/s11547-019-01040-w. Epub 2019 May 13. Radiol Med. 2019. PMID: 31087215
References
-
- Moran G.J., Barrett T.W., Mower W.R. Decision instrument for the isolation of pneumonia patients with suspected pulmonary tuberculosis admitted through US emergency departments. Ann Emerg Med. 2009;53(5):625–632. - PubMed
-
- Liam C.K., Pang Y.K., Poosparajah S. Pulmonary tuberculosis presenting as community-acquired pneumonia. Respirology. 2006;11(6):786–792. - PubMed
-
- Craig S.E., Bettinson H., Sabin C.A., Gillespie S.H., Lipman M.C. Think TB! Is the diagnosis of pulmonary tuberculosis delayed by the use of antibiotics? Int J Tuberc Lung Dis. 2009;13(2):208–213. - PubMed
-
- Haley C.E., McDonald R.C., Rossi L., Jones W.D., Jr., Haley R.W., Luby J.P. Tuberculosis epidemic among hospital personnel. Infect Control Hosp Epidemiol. 1989;10(5):204–210. - PubMed
MeSH terms
LinkOut - more resources
Full Text Sources
Medical
Miscellaneous
