

Use of dynamic contrast-enhanced MRI to measure subtle blood-brain barrier abnormalities
- PMID: 21030178
- PMCID: PMC4025605
- DOI: 10.1016/j.mri.2010.09.002
Use of dynamic contrast-enhanced MRI to measure subtle blood-brain barrier abnormalities
Abstract
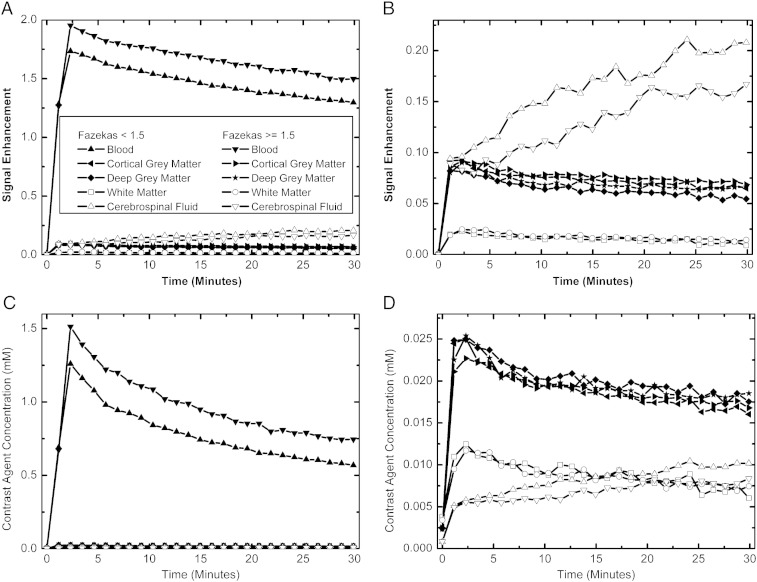
There is growing interest in investigating the role of subtle changes in blood-brain barrier (BBB) function in common neurological disorders and the possible use of imaging techniques to assess these abnormalities. Some studies have used dynamic contrast-enhanced MR imaging (DCE-MRI) and these have demonstrated much smaller signal changes than obtained from more traditional applications of the technique, such as in intracranial tumors and multiple sclerosis. In this work, preliminary results are presented from a DCE-MRI study of patients with mild stroke classified according to the extent of visible underlying white matter abnormalities. These data are used to estimate typical signal enhancement profiles in different tissue types and by degrees of white matter abnormality. The effect of scanner noise, drift and different intrinsic tissue properties on signal enhancement data is also investigated and the likely implications for interpreting the enhancement profiles are discussed. No significant differences in average signal enhancement or contrast agent concentration were observed between patients with different degrees of white matter abnormality, although there was a trend towards greater signal enhancement with more abnormal white matter. Furthermore, the results suggest that many of the factors considered introduce uncertainty of a similar magnitude to expected effect sizes, making it unclear whether differences in signal enhancement are truly reflective of an underlying BBB abnormality or due to an unrelated effect. As the ultimate aim is to achieve a reliable quantification of BBB function in subtle disorders, this study highlights the factors which may influence signal enhancement and suggests that further work is required to address the challenging problems of quantifying contrast agent concentration in healthy and diseased living human tissue and of establishing a suitable model to enable quantification of relevant physiological parameters. Meanwhile, it is essential that future studies use an appropriate control group to minimize these influences.
Copyright © 2011 Elsevier Inc. All rights reserved.
Figures

References
-
- Brix G., Semmler W., Port R., Schad L.R., Layer G., Lorenz W.J. Pharmacokinetic parameters in CNS Gd-DTPA enhanced MR imaging. J Comput Assist Tomogr. 1991;15:621–628. - PubMed
-
- Parker G.J.M., Tofts P.S. Pharmacokinetic analysis of neoplasms using contrast-enhanced dynamic magnetic resonance imaging. Top Magn Reson Imag. 1999;10:130–142. - PubMed
-
- Harrer J.U., Parker G.J.M., Haroon H.A., Buckley D.L., Embelton K., Roberts C., Baleriaux D., Jackson A. Comparative study of methods for determining vascular permeability and blood volume in human gliomas. J Magn Reson Imaging. 2004;20:748–757. - PubMed
-
- Kermode A.G., Thompson A.J., Tofts P.S. Breakdown of the blood–brain barrier precedes symptoms and other MRI signs of new lesions in multiple sclerosis: pathogenic and clinical implications. Brain. 1990;113:1477–1489. - PubMed
-
- Katz D., Taubenberger J.K., Hashimoto S.A. Correlation between magnetic resonance imaging findings and lesion development in chronic, active multiple sclerosis. Ann Neurol. 1993;34:661–669. - PubMed
Publication types
MeSH terms
Substances
Grants and funding
LinkOut - more resources
Full Text Sources
Other Literature Sources
Medical
Research Materials
