

In situ parameter identification of optimal density-elastic modulus relationships in subject-specific finite element models of the proximal femur
- PMID: 21030287
- PMCID: PMC3045472
- DOI: 10.1016/j.medengphy.2010.09.018
In situ parameter identification of optimal density-elastic modulus relationships in subject-specific finite element models of the proximal femur
Abstract
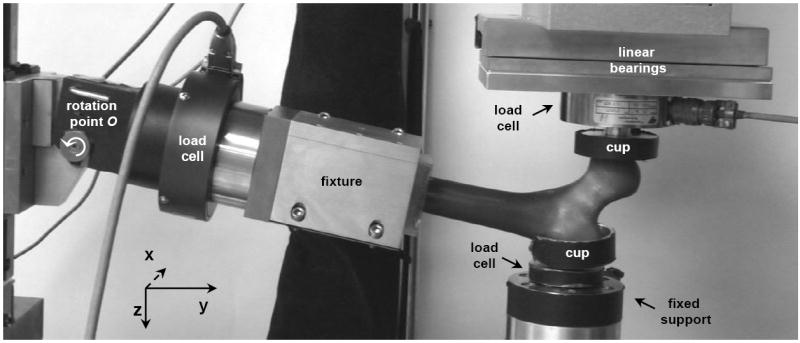
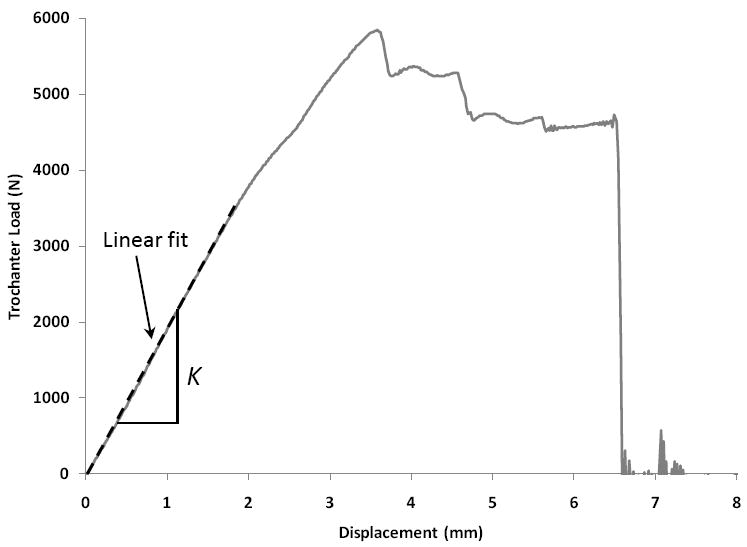
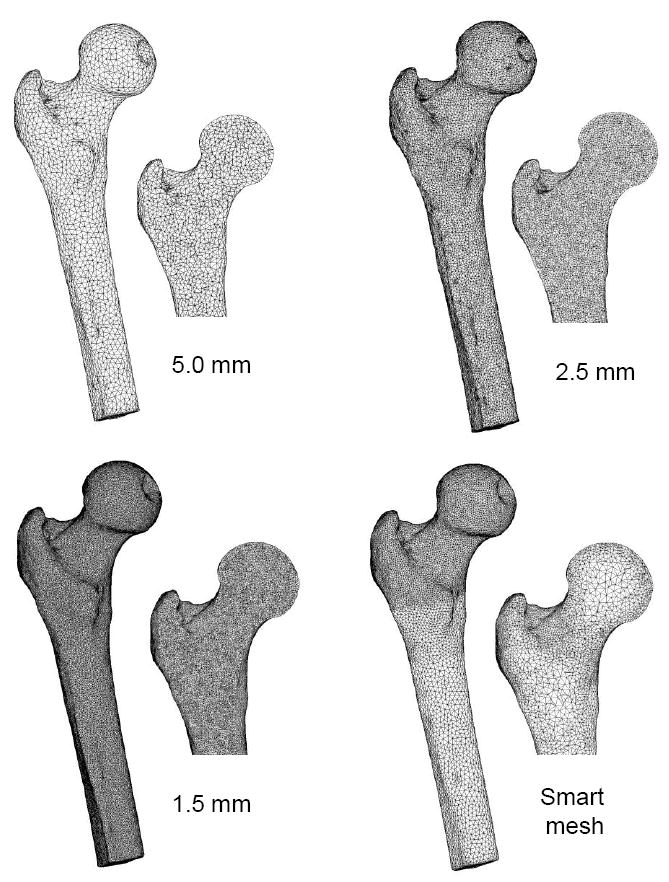
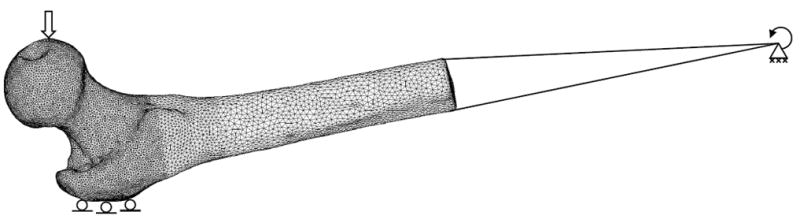
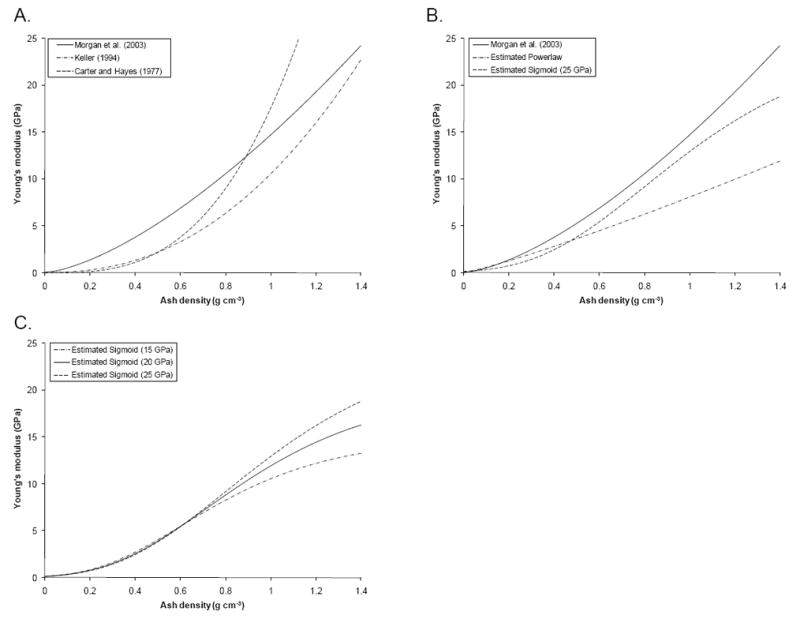
Quantitative computed tomography based finite element analysis of the femur is currently being investigated as a method for non-invasive stiffness and strength predictions of the proximal femur. The specific objective of this study was to determine better conversion relationships from QCT-derived bone density to elastic modulus, in order to achieve accurate predictions of the overall femoral stiffness in a fall-on-the-hip loading configuration. Twenty-two femurs were scanned, segmented and meshed for finite element analysis. The elastic moduli of the elements were assigned according to the average density in the element. The femurs were then tested to fracture and force-displacement data were collected to calculate femoral stiffness. Using a training set of nine femurs, finite element analyses were performed and the parameters of the density-elastic modulus relationship were iteratively adjusted to obtain optimal stiffness predictions in a least-squares sense. The results were then validated on the remaining 13 femurs. Our novel procedure resulted in parameter identification of both power and sigmoid functions for density-elastic modulus conversion for this specific loading scenario. Our in situ estimated power law achieved improved predictions compared to published power laws, and the sigmoid function yielded even smaller prediction errors. In the future, these results will be used to further improve the femoral strength predictions of our finite element models.
Copyright © 2010 IPEM. Published by Elsevier Ltd. All rights reserved.
Figures
Similar articles
-
Prediction of local proximal tibial subchondral bone structural stiffness using subject-specific finite element modeling: Effect of selected density-modulus relationship.Clin Biomech (Bristol). 2015 Aug;30(7):703-12. doi: 10.1016/j.clinbiomech.2015.05.002. Epub 2015 May 14. Clin Biomech (Bristol). 2015. PMID: 26024555
-
Finite element models predict cancellous apparent modulus when tissue modulus is scaled from specimen CT-attenuation.J Biomech. 2004 May;37(5):613-21. doi: 10.1016/j.jbiomech.2003.10.002. J Biomech. 2004. PMID: 15046990
-
Are DXA/aBMD and QCT/FEA Stiffness and Strength Estimates Sensitive to Sex and Age?Ann Biomed Eng. 2017 Dec;45(12):2847-2856. doi: 10.1007/s10439-017-1914-5. Epub 2017 Sep 22. Ann Biomed Eng. 2017. PMID: 28940110 Free PMC article.
-
Are CT-Based Finite Element Model Predictions of Femoral Bone Strength Clinically Useful?Curr Osteoporos Rep. 2018 Jun;16(3):216-223. doi: 10.1007/s11914-018-0438-8. Curr Osteoporos Rep. 2018. PMID: 29656377 Free PMC article. Review.
-
From bed to bench: How in silico medicine can help ageing research.Mech Ageing Dev. 2019 Jan;177:103-108. doi: 10.1016/j.mad.2018.07.001. Epub 2018 Jul 10. Mech Ageing Dev. 2019. PMID: 30005915 Review.
Cited by
-
Neuro-musculoskeletal flexible multibody simulation yields a framework for efficient bone failure risk assessment.Sci Rep. 2019 May 6;9(1):6928. doi: 10.1038/s41598-019-43028-6. Sci Rep. 2019. PMID: 31061388 Free PMC article.
-
Quantitative Computed Tomography (QCT) derived Bone Mineral Density (BMD) in finite element studies: a review of the literature.J Exp Orthop. 2016 Dec;3(1):36. doi: 10.1186/s40634-016-0072-2. Epub 2016 Dec 9. J Exp Orthop. 2016. PMID: 27943224 Free PMC article. Review.
-
Quantitative Computed Tomography Protocols Affect Material Mapping and Quantitative Computed Tomography-Based Finite-Element Analysis Predicted Stiffness.J Biomech Eng. 2016 Sep 1;138(9):0910031-7. doi: 10.1115/1.4034172. J Biomech Eng. 2016. PMID: 27428281 Free PMC article.
-
Maximum principal strain as a criterion for prediction of orthodontic mini-implants failure in subject-specific finite element models.Angle Orthod. 2016 Jan;86(1):24-31. doi: 10.2319/120514-875.1. Epub 2015 Apr 1. Angle Orthod. 2016. PMID: 25830709 Free PMC article.
-
Finite Element-Based Mechanical Assessment of Bone Quality on the Basis of In Vivo Images.Curr Osteoporos Rep. 2016 Dec;14(6):374-385. doi: 10.1007/s11914-016-0335-y. Curr Osteoporos Rep. 2016. PMID: 27714581 Review.
References
-
- Melton LJ, Cummings SR. Heterogeneity of age-related fractures: implications for epidemiology. Bone Miner. 1987;2(4):321–331. - PubMed
-
- Sambrook P, Cooper C. Osteoporosis. Lancet. 2006;367(9527):2010–2018. - PubMed
-
- Hayes WC, Myers ER, Morris JN, Gerhart TN, Yett HS, Lipsitz LA. Impact near the hip dominates fracture risk in elderly nursing home residents who fall. Calcif Tissue Int. 1993;52(3):192–198. - PubMed
-
- Kanis JA, McCloskey EV, Johansson H, Oden A, Melton LJ, Khaltaev N. A reference standard for the description of osteoporosis. Bone. 2008;42(3):467–475. - PubMed
-
- Cody DD, Gross GJ, Hou FJ, Spencer HJ, Goldstein SA, Fyhrie DP. Femoral strength is better predicted by finite element models than QCT and DXA. J Biomech. 1999;32(10):1013–1020. - PubMed
Publication types
MeSH terms
Grants and funding
LinkOut - more resources
Full Text Sources
Medical
