. 2010 Dec;38(22):8164-77.
doi: 10.1093/nar/gkq955. Epub 2010 Oct 28.

Mapping of long-range associations throughout the fission yeast genome reveals global genome organization linked to transcriptional regulation

Affiliations

Mapping of long-range associations throughout the fission yeast genome reveals global genome organization linked to transcriptional regulation

Hideki Tanizawa et al. Nucleic Acids Res. 2010 Dec.

Abstract

We have comprehensively mapped long-range associations between chromosomal regions throughout the fission yeast genome using the latest genomics approach that combines next generation sequencing and chromosome conformation capture (3C). Our relatively simple approach, referred to as enrichment of ligation products (ELP), involves digestion of the 3C sample with a 4 bp cutter and self-ligation, achieving a resolution of 20 kb. It recaptures previously characterized genome organizations and also identifies new and important interactions. We have modeled the 3D structure of the entire fission yeast genome and have explored the functional relationships between the global genome organization and transcriptional regulation. We find significant associations among highly transcribed genes. Moreover, we demonstrate that genes co-regulated during the cell cycle tend to associate with one another when activated. Remarkably, functionally defined genes derived from particular gene ontology groups tend to associate in a statistically significant manner. Those significantly associating genes frequently contain the same DNA motifs at their promoter regions, suggesting that potential transcription factors binding to these motifs are involved in defining the associations among those genes. Our study suggests the presence of a global genome organization in fission yeast that is functionally similar to the recently proposed mammalian transcription factory.


Figures

Figure 1.
Figure 1.
Capturing long-range associations between DNA fragments throughout the fission yeast genome. (A) Strategy of our genomics approach combining 3C and the massively parallel sequencing. The 3C procedure was followed by the ELP method, and the resultant sample was subjected to sequencing. (B) Detection of the association between centromeres 1 and 2 by 3C. The physical interaction between centromeres 1 and 2 was analyzed by 3C. The ade6 gene locus serves as a negative control for association with centromeres. H indicates HindIII sites. The filled triangles show the locations and directions of the PCR primers used for 3C analysis. RL denotes the random ligation control sample. For the RL sample, un-cross-linked genomic DNA was cleaved by HindIII and randomly ligated by T4 DNA ligase. In contrast to the RL sample, the 3C sample reflects physical interaction between two distant genomic loci. Three primers were used for one PCR reaction. The bottom band in the 3C lane was relatively more intense than the two upper bands, suggesting an interaction between centromeres 1 and 2. 3C analyses were repeated three times, and the average value of relative physical proximity is shown beneath the representative result. This PCR-based assay shows reliability of the 3C procedure used for fission yeast, although global genome organization was from here on investigated based on the sequencing data. (C) Comparison between sequencing results derived from the ELP and sonication control samples. Approximately nine times more paired reads from the ELP sample compared to control remained after the filtering processes, indicating that the ELP method significantly enriches DNA fragments reflecting associations between distant genomic loci.
Figure 2.
Figure 2.
Comprehensive mapping of long-range associations throughout the fission yeast genome. Physical proximity values reflecting average association frequencies between 20 kb genomic sections in the cell population were calculated as described in Supplementary Figure S1 (‘Materials and Methods’ section) and plotted in the map. The physical proximity values noted in the enlarged views (1, 2 and 3) were verified by FISH (Figure 3C).
Figure 3.
Figure 3.
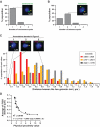
Verification of physical proximity values by FISH. (A) Visualizing centromeric clustering by FISH. FISH signal (green) visualizing centromeres 1, 2 and 3 often displayed a single spot, indicating the association among centromeres. Blue is DAPI signal. Typical image is shown on top. (B) Telomere association was visualized by FISH. FISH probe recognizes four telomeric regions in chromosomes 1 and 2. One or two FISH spots were frequently observed, indicating telomere associations. (C) The physical proximity values (1, 2 and 3) denoted in Figure 2 were evaluated by FISH. The two distant genomic loci (green and red) were visualized by FISH using the cosmid clones, and merged with DAPI signals (blue). Several images are shown on top. In each image, measurement of the distance between the genomic loci is indicated by linking the image with the histogram. The distance was measured between two focal centers. The percent populations of the observed distances between the genomic loci were binned into 0.1 μm. (D) Strong correlation between physical proximity values in the map and FISH data. Eighteen pairs of distant genomic loci were analyzed by FISH. The 18 combinations of genomic loci are annotated in Supplementary Table S1. Averages of distance values measured between two FISH spots were plotted along with physical proximity values between two genomic loci.
Figure 4.
Figure 4.
Modeled 3D structure of the fission yeast genome. (A) The 3D genome structure was modeled at a 20 kb resolution based on physical proximity values. Individual chromosomes are represented by different colors. Centromeres (open circle) in all three chromosomes are set to be clustered as an initial modeling constraint (‘Materials and Methods’ section). Telomeres in chromosomes 1 and 2 are highlighted by spheres. Telomeres in chromosome 3 consist of rDNA repeats and are known to be structurally distinct from telomeres in chromosomes 1 and 2. (B) Scatter plot of distances between two genomic loci in the modeled structure versus distances observed by FISH. Eighteen combinations of two distant genomic loci were analyzed by FISH (Figure 3D). FISH distances for each combination were measured in >100 cells. Due to the distributions of FISH measurements, 30% of data points were truncated from both tails in order to remove possible outliers and the remaining middle 40% of FISH data were plotted. The dotted lines represent the 45° line. The scatter plot indicated the high R2-value (0.8970), supporting that the modeled genome structure strongly correlate with FISH data.
Figure 5.
Figure 5.
Significant associations among highly expressed genes and co-regulated genes during the cell cycle. (A) Associations among genomic sections containing LTR derived from retrotransposons. Figures in parenthesis indicate the number of 20 kb genomic sections containing LTR. The total physical proximity value was calculated as a sum of physical proximity values corresponding to all combinations among 80 genomic sections randomly selected from 153 sections containing LTR. Distribution of total physical proximity values was built by 1000 permutations. For the random control, 80 genomic sections were randomly picked from entire genomic sections, followed by 1000 permutations. The statistical analysis to test the significance of associations among LTRs (yellow) compared to random control (light blue) is described in ‘Materials and Methods’ section. (B) Highly expressed genes, but not poorly expressed genes, tend to associate together. The highly expressed and poorly expressed gene sections were classified as described in ‘Materials and Methods’ section. The statistical analyses were carried out as described in A. (C) G2 genes showing the expression peak during G2 phase tend to associate with one another (left), whereas association frequencies among M genes did not differ from the random control (right). The statistical analyses for G2 genes were carried out as described in (A). For M genes, 50 genomic sections were randomly selected from 73 genomic sections containing M genes, followed by 1000 permutations. (D) A new DNA motif identified at the upstream regions of G2 genes. Twenty-one of a total of 118 G2 genes contained the motif. This motif did not match the previously identified motifs listed in the TRANSFAC database (25). (E) G2 genes containing the motif showed significantly enhanced associations compared to the associations among entire G2 gene members. The red bar indicates the total physical proximity value among 21 G2 genes containing the motif. To test the significance of associations among G2 genes containing the motif, 21 G2 genes were randomly selected from a total of 118 G2 genes, and total physical proximity values were calculated. Distribution of 1000 permutations was plotted (yellow) and used for the calculation of the P-value. Associations that scored with physical proximity values more than 1.5 are listed in Supplementary Table S2. (F) Motif-containing G2 genes (red spheres) are shown in the modeled genome structure. The several motif-containing G2 genes were positioned in proximity (open circles).
Figure 6.
Figure 6.
Significant associations among genes in gene ontology groups. (A) Genes in 23 gene ontology groups displayed significant associations. The average physical proximity values for 467 gene ontology groups were plotted in the graph (left). Average physical proximity value was calculated as total physical proximity value divided by total number of combinations among every genomics section containing genes in each gene ontology group. Significance of associations among genes in respective gene ontology groups was tested as described in ‘Materials and Methods’ section. Twenty-three gene ontology groups revealing significant associations are shown by filled circles. Several gene ontology groups derived from the same parent gene ontology groups are represented in the same colors. The size of the circles correlates with the significance of gene associations. Gene ontology groups revealing significant gene associations are listed along with the P-values (right). Six gene ontology groups were removed from 23 initially identified gene ontology groups, because they shared a major population of genes with other groups. Descriptions of respective gene ontology groups showing significant associations are provided in Supplementary Table S3. (B) Enhanced associations among genes in the particular gene ontology groups through new DNA motifs. All 17 gene ontology groups showing significant associations were subjected to the DNA motif analyses and four significant motifs were identified (‘Materials and Methods’ section). These motifs did not match the previously identified motifs listed in the TRANSFAC database (25). Numbers of genes contained the motifs are shown next to the motifs. Figures in parentheses indicate total numbers of genes in respective gene ontology groups. The statistical test was carried out as described in Figure 5E. The total physical proximity values among motif-including genes (red) were compared to distributions of values derived from entire gene members in respective gene ontology groups (filled yellow). Associations that scored with physical proximity values >1.5 are listed in Supplementary Table S2. (C) Positions of motif-including genes in cellular carbohydrate catabolic process (red spheres) are shown in the modeled genome structure. The several motif-including genes were present in the vicinity (open circles). (D) Increase in population showing weak associations among genes in gene ontology groups compared to the random control. Distribution of average physical proximity values of the actual 467 gene ontology groups (red) was compared to distribution derived from 467 hypothetical groups (blue) containing the same number of randomly selected genes.

References

    1. Misteli T. Beyond the sequence: cellular organization of genome function. Cell. 2007;128:787–800. - PubMed
    1. Iwasaki O, Tanaka A, Tanizawa H, Grewal SI, Noma K. Centromeric localization of dispersed Pol III genes in fission yeast. Mol. Biol. Cell. 2010;21:254–265. - PMC - PubMed
    1. Thompson M, Haeusler RA, Good PD, Engelke DR. Nucleolar clustering of dispersed tRNA genes. Science. 2003;302:1399–1401. - PMC - PubMed
    1. Fraser P, Bickmore W. Nuclear organization of the genome and the potential for gene regulation. Nature. 2007;447:413–417. - PubMed
    1. Jackson DA, Hassan AB, Errington RJ, Cook PR. Visualization of focal sites of transcription within human nuclei. EMBO J. 1993;12:1059–1065. - PMC - PubMed

Publication types