. 2011 Mar;39(4):1326-35.
doi: 10.1093/nar/gkq994. Epub 2010 Oct 28.

Synergism between DNA methylation and macroH2A1 occupancy in epigenetic silencing of the tumor suppressor gene p16(CDKN2A)

Affiliations

Synergism between DNA methylation and macroH2A1 occupancy in epigenetic silencing of the tumor suppressor gene p16(CDKN2A)

Michal Barzily-Rokni et al. Nucleic Acids Res. 2011 Mar.

Abstract

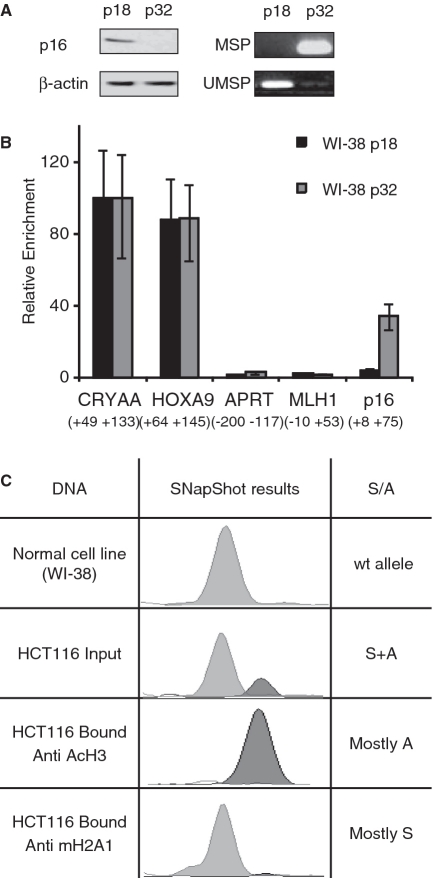
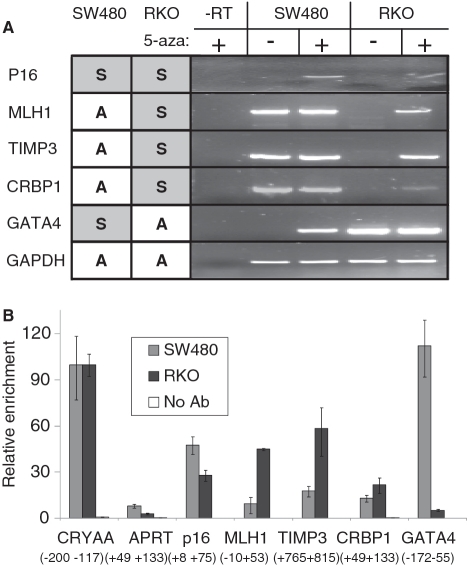
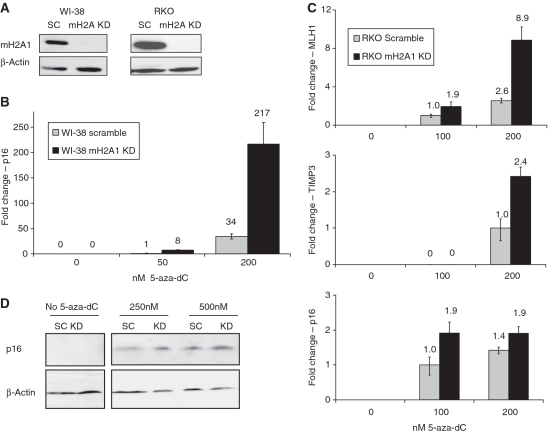
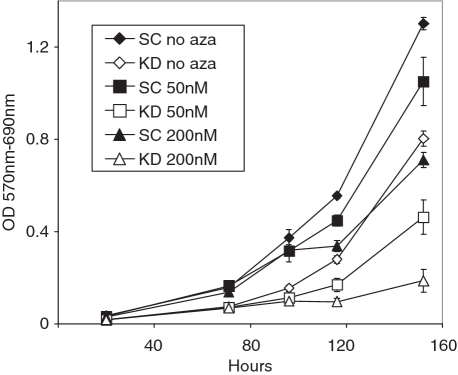
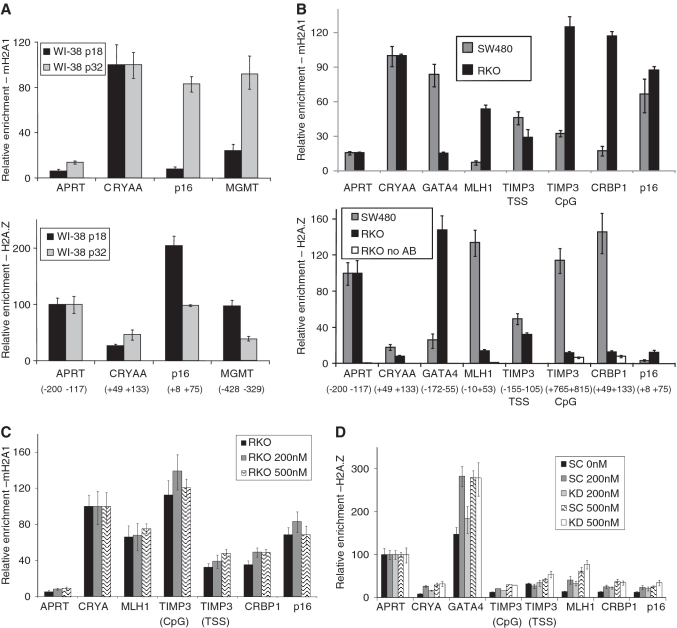
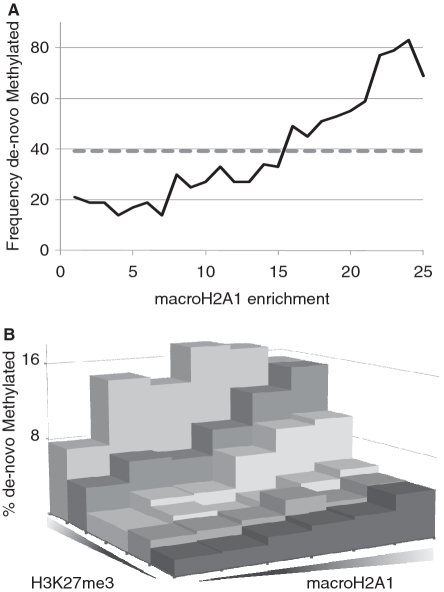
Promoter hypermethylation and heterochromatinization is a frequent event leading to gene inactivation and tumorigenesis. At the molecular level, inactivation of tumor suppressor genes in cancer has many similarities to the inactive X chromosome in female cells and is defined and maintained by DNA methylation and characteristic histone modifications. In addition, the inactive-X is marked by the histone macroH2A, a variant of H2A with a large non-histone region of unknown function. Studying tumor suppressor genes (TSGs) silenced in cancer cell lines, we find that when active, these promoters are associated with H2A.Z but become enriched for macroH2A1 once silenced. Knockdown of macroH2A1 was not sufficient for reactivation of silenced genes. However, when combined with DNA demethylation, macroH2A1 deficiency significantly enhanced reactivation of the tumor suppressor genes p16, MLH1 and Timp3 and inhibited cell proliferation. Our findings link macroH2A1 to heterochromatin of epigenetically silenced cancer genes and indicate synergism between macroH2A1 and DNA methylation in maintenance of the silenced state.


Figures

Figure 1.
Figure 1.
Silencing of CDKN2A is accompanied by macroH2A1 enrichment. (A) Expression and methylation status of CDKN2A in early passage (p18) and late passage (p32) WI-38 cell: western blot for p16 and β-actin showing loss of expression in p32 cells (left panel). Methylation of the CDKN2A promoter in p32 cell confirmed by methylation-specific PCR (MSP) on bisulfite-modified DNA (right panel). (B) ChIP with macroH2A1 antibody. The bound/input ratio for each cell line was calculated using quantitative real-time PCR. To compare between cell lines, enrichment of the bound fraction was normalized according to the positive control α-Crystallin, which is inactive in both cultures (Supplementary Figure S6). An 8.5-fold enrichment for macroH2A1 at the CDKN2A promoter is observed in p32 cells versus p18 cells. Similar results were observed in three biological replicates (see also Figure 5). HoxA9 is another positive control and is not expressed. Aprt and MLH1 are expressed in both samples. The numbers under the gene names indicate position of the interrogated region relative to TSS. Error bars represent standard deviation. (C) ChIP analysis using anti-macroH2A1 or anti-acetylated H3 antibody on HCT116 cells. Input and bound fractions were analyzed by SNaPshot assay to discriminate between the silenced (wild-type) allele of CDKN2A (S) and the active mutant allele (A). The ratio between the two alleles (S/A ratio) was determined based on peak area using Genotyper 2.1 software (ABI PRISM).
Figure 2.
Figure 2.
MacroH2A1 is associated with epigenetically silenced TSG in colon cancer cell lines. (A) Epigenetic status of selected genes in RKO and SW480 cells was confirmed by assaying for reactivation upon demethylation. Cells were cultured with 1 μM 5-aza-dC for 5 days and transcription was evaluated by RT–PCR. Genes that were expressed before treatment were considered active (A). Genes that became transcribed only upon demethylation were considered to be epigenetically silenced (S). Results were consistent with previously published reports on these cell lines (10,46). (B) Chromatin immunoprecipitation using anti-macroH2A1 antibody. Enrichment for macroH2A1 at promoter regions was measured by real-time PCR analysis of the bound fraction relative to input. To compare between RKO and SW480 cells the bound/input values were normalized according to the positive control α-Crystallin (CRYAA, which is inactive in both cultures, Supplementary Figure S6). The numbers under the gene names indicate position of the interrogated region relative to TSS. Error bars correspond to standard deviation of the ΔΔCt. IP with no antibody gave very low background signal. Similar results were observed in three repeated experiments (see also Figure 5).
Figure 3.
Figure 3.
KD of macroH2A1 facilitates TSGs reactivation. (A) Western blot showing levels of macroH2A1 in WI-38 (passage 32) and RKO cells infected with Lentiviral macroH2A1 specific shRNA (mH2A KD) or scrambled shRNA (SC). (B) Real-time RT-PCR analysis of p16 expression in WI-38 (passage 32) cells with macroH2A1 KD or scrambled KD following treatment with 5-aza-dC. cDNA was analyzed using real-time PCR and the p16 expression level was normalized to GAPDH. Graph shows fold change in expression level relative to control (scrambled KD) treated with 50 nM 5-aza-dC. KD of macroH2A1 resulted in an 8-fold increase in p16 levels following treatment with 50n M 5-aza-dC. (C) Quantitative real-time RT-PCR analysis of MLH1, TIMP3 and p16 expression in RKO cells. In three repeated experiments, macroH2A1-deficient cells consistently show better reactivation following treatment with low concentrations of 5-aza-dC. (D) Western blot analysis of p16 levels in HCT116 colon cancer cell line carrying macroH2A1 KD or scrambled shRNA. Because HCT116 cells express a mutated transcript for one allele, the analysis was done using western blot analysis and detects only expression from the silenced allele. p16 expression following treatment with 5-aza-dC is enhanced in macroH2A1-deficient cells.
Figure 4.
Figure 4.
KD of macroH2A1 inhibits proliferation of RKO cells. Growth curves of RKO cells deficient for macroH2A1. Cells were cultured in 96 well plates (3000 cells/well) with 0, 50 or 200 nM 5-aza-dC for 6 days. Proliferation of cells was determined using MTT assay.
Figure 5.
Figure 5.
Inverse relations between macroH2A1 and H2A.Z in active and silenced TSGs promoters. Chromatin immunoprecipitation using anti-macroH2A1 antibody and anti-H2A.Z antibody on WI-38 early and late passage (A) or RKO and SW480 cells (B). Enrichment for macroH2A1 was normalized to the positive control α-crystallin (CRYAA). H2A.Z enrichment was normalized to APRT, and α-Crystallin served as the negative control. Error bars correspond to standard deviation of the ΔΔCt. IP with no antibody gave very low background signal. MGMT promoter was found to be silenced and methylated in late passage WI-38 cells but was not reactivated even following treatment with 1 µM 5-aza-dC (data not shown). For TIMP3 promoter, enrichment was measured both near the transcription start site (TSS) and at the adjacent CpG island (CpG). (C) MacroH2A enrichment before and after 5-aza-dC treatment. High levels of macroH2A enrichment are observed in silenced TSGs, before and after treatment with 200 or 500 nM 5-aza-dC. (D) H2A.Z enrichment before and after 5-aza-dC treatment and macroH2A1 KD. H2A.Z is depleted from silenced loci and no change in H2A.Z levels is observed after treatment which facilitated gene reactivation.
Figure 6.
Figure 6.
Probability of de-novo methylation as a function of macroH2A1 enrichment. (A) x-Axis describes macroH2A1 enrichment at 18 976 CpG sites in IMR90 lung fibroblasts (all probes are within CpG islands). Sites were grouped into 25 equal size groups, from the least enriched (group 1) to the most enriched sites (group 25). For each group we calculated the fraction of probes that were de-novo DNA methylated in late passage WI-38 cells compared to primary WI-38 culture (see Supplementary Data for additional details). The dashed line represents the expected result assuming uniform distribution. The results show that macroH2A1 enriched regions undergo de-novo methylation more frequently. (B) Same data as in A divided into 36 groups according to both macroH2A1 and H3K27me3 levels in primary lung fibroblasts. For each group we determined the percentage of probes showing de novo DNA methylation in late passage.

References

    1. Jones PA, Baylin SB. The epigenomics of cancer. Cell. 2007;128:683–692. - PMC - PubMed
    1. Esteller M. Epigenetics in cancer. N. Engl. J. Med. 2008;358:1148–1159. - PubMed
    1. Esteller M. Cancer epigenomics: DNA methylomes and histone-modification maps. Nat. Rev. Genet. 2007;8:286–298. - PubMed
    1. Heard E. Delving into the diversity of facultative heterochromatin: the epigenetics of the inactive X chromosome. Curr. Opin. Genet. Dev. 2005;15:482–489. - PubMed
    1. Mohandas T, Sparkes RS, Shapiro LJ. Reactivation of an inactive human X chromosome: evidence for X inactivation by DNA methylation. Science. 1981;211:393–396. - PubMed

Publication types