Comparative Study
. 2011 Jan 27;117(4):1156-66.
doi: 10.1182/blood-2010-04-279349. Epub 2010 Oct 28.

Ewing sarcoma gene Ews regulates hematopoietic stem cell senescence

Affiliations
Comparative Study

Ewing sarcoma gene Ews regulates hematopoietic stem cell senescence

Joonseok Cho et al. Blood. .

Abstract

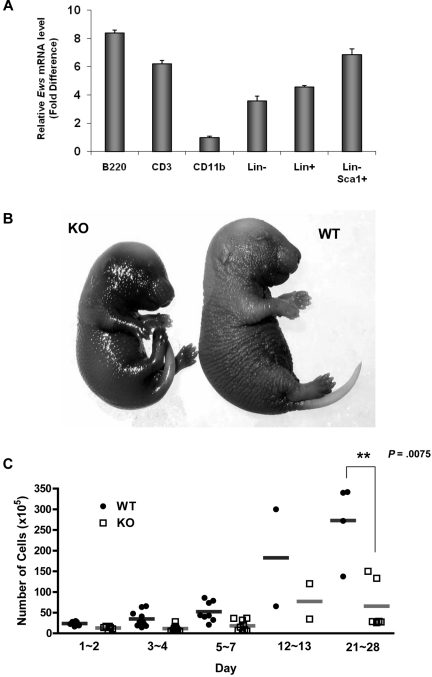
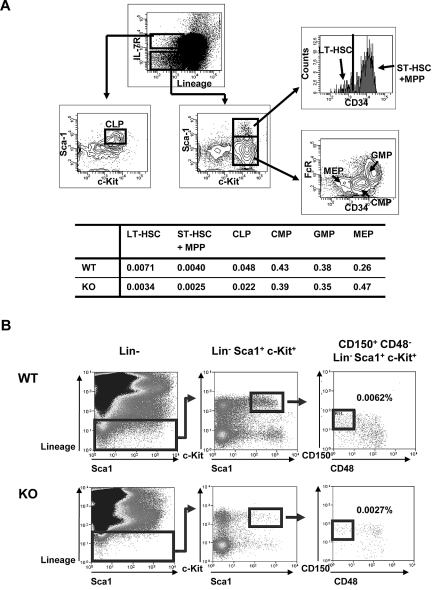
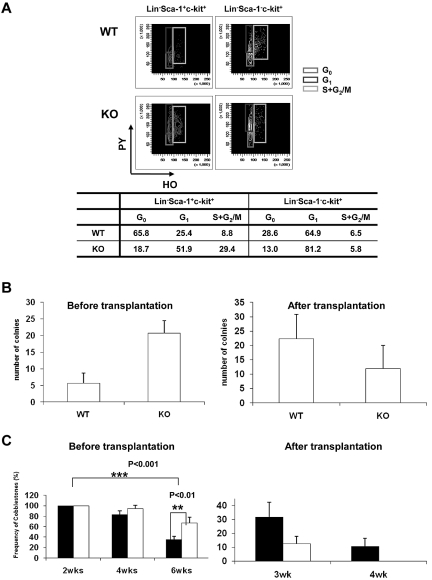
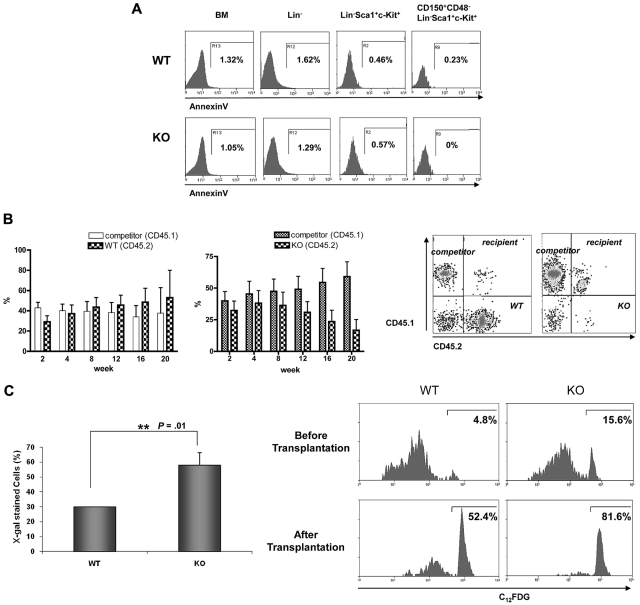
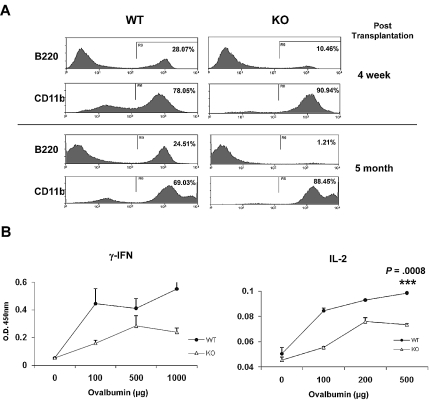
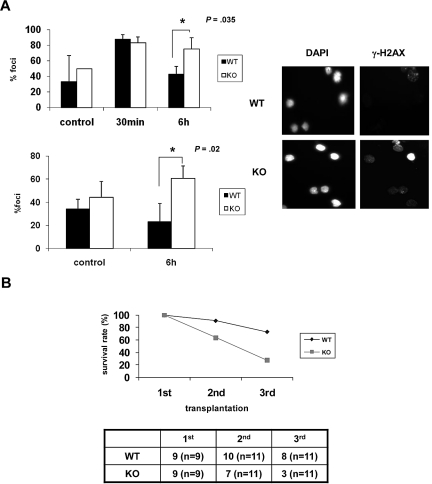
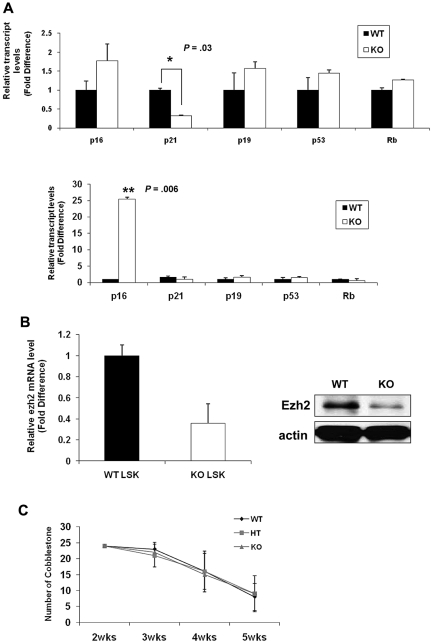
The longevity of organisms is maintained by stem cells. If an organism loses the ability to maintain a balance between quiescence and differentiation in the stem/progenitor cell compartment due to aging and/or stress, this may result in death or age-associated diseases, including cancer. Ewing sarcoma is the most lethal bone tumor in young patients and arises from primitive stem cells. Here, we demonstrated that endogenous Ewing sarcoma gene (Ews) is indispensable for stem cell quiescence, and that the ablation of Ews promotes the early onset of senescence in hematopoietic stem progenitor cells. The phenotypic and functional changes in Ews-deficient stem cells were accompanied by an increase in senescence-associated β-galactosidase staining and a marked induction of p16(INK4a) compared with wild-type counterparts. With its relevance to cancer and possibly aging, EWS is likely to play a significant role in maintaining the functional capacity of stem cells and may provide further insight into the complexity of Ewing sarcoma in the context of stem cells.


Figures

Figure 1
Figure 1
Ews deletion accelerates cellular senescence from prenatal stages and leads to a significant decrease in BM cellularity. (A) The mononuclear cells from normal adult mice were sorted based on lineage marker expression. Antibodies to B220, CD3, and CD11b were used to enrich B (from spleen), T (from thymus), and myeloid (from BM) lineages, respectively. Lineage-negative (Lin) and positive (Lin+) BM cells were enriched by magnetic separation. Lin cells were further fractionated on the basis of Sca1 expression (Lin Sca1+). The purity of the sorted populations was > 92%. Quantitative RT-PCR was performed as described in “Quantitative real-time PCR.” Expression was normalized to the endogenous Gapdh. The fold difference in expression of Ews was calculated using the ΔΔCt method. CD11b+ cells, where the lowest Ews expression was detected, was set arbitrarily as 1.0. Data are presented as mean values ± SD. (B) Embryos (E16.5-E18.5) were collected from pregnant dams and stained for SA-β-gal. Pictures show representative embryos from 3 additional independent experiments. (C) BM cells from Ews+/+ and Ews−/− mice were harvested during the postnatal period. Total nucleated BM cellularity was determined by hemocytometer counting from birth through postnatal day (PND) 28. **P = .0075 by 2-tailed Student t test.
Figure 2
Figure 2
Analysis of hematopoietic stem and progenitor cell populations in Ews KO and WT mice. (A) Top panel: schematic diagram of gating strategy; freshly isolated BM cells from Ews−/− and WT littermate control (Ews+/+) mice were stained with the indicated antibodies and analyzed by flow cytometry. LT-HSC indicates long-term hematopoietic stem cell (defined as LinSca1+ c-Kit+ and CD34); and ST-HSC + MPP, short-term hematopoietic stem cell including multipotent progenitors (defined as LinSca1+c-Kit+ and CD34+). CLP indicates common lymphoid progenitors; CMP, common myeloid progenitors; GMP, granulocyte-monocyte progenitors; and MEP, megakaryocyte-erythroid precursor. Bottom panel: the percentage of cells in each group is summarized in the accompanying table. At least 3 pairs of Ews−/− mice and WT littermate control mice from different dams were analyzed. A representative plot is shown. (B) BM cells from Ews+/+ (WT) and Ews−/− (KO) were sequentially gated as shown to quantify CD150+CD48LinSca1+c-Kit+ cells. Numbers represent the percentages of CD150+CD48LinSca1+c-Kit+ cells in the gated populations. At least 3 pairs of Ews−/− mice and WT littermate control mice from different dams were analyzed. A representative plot is shown.
Figure 3
Figure 3
Ews deletion drives cell-cycle progression in hematopoietic stem and progenitor cell populations and modulates progenitor cell activity. (A) Flow cytometric analysis of PY (Pyronin-Y) and HO (Hoechst 33342) staining of LinSca1+c-Kit+ and LinSca1c-Kit+ cells from Ews KO and WT littermate controls. The percentage of cells in each phase of the cell cycle is summarized in the accompanying table. Data shown are representative of 2 independent experiments. (B) CFU-S assay. At day 12, spleens were removed and fixed in Bouin fixative and CFU-S colonies were counted. The CFU-S activity of Ews−/− (KO) and Ews+/+ littermate control (WT) BM cells was assessed before transplantation and after 2 rounds of transplantation (after transplantation). Of note, when Ews−/− BM cells were subjected to transplantation, their CFU-S activity was markedly decreased and showed a lower CFU-S activity compared with that of WT. Data are presented as mean values ± SD. (C) CAFC assay. The CAFC activity of Ews−/− (KO; white bar) and Ews+/+ littermate control (WT; black bar) BM cells was assessed before transplantation and after 2 rounds of transplantation (after transplantation). Of note, Ews−/− BM cells did not have measurable week-4 CAFC activity after BM transplantation, which is indicative of progenitor cell exhaustion. A total of 48 replicate wells were prepared per dilution and evaluated. Any well that had a colony of more than 6 cobblestone cells growing underneath the stromal cell layer was scored as positive. The y-axis denotes the percentage (%) of positive wells. Data are presented as mean ± SD. *Statistically significant difference (2-tailed Student t test, n > 4).
Figure 4
Figure 4
Progressive loss of competitive repopulating activity is accompanied by an increase in SA-β-gal expression in hematopoietic stem progenitor cells. (A) BM cells derived from Ews−/− and WT littermates were stained as described in Methods for Lin, LSK, and CD150+CD48 LSK populations and subsequently analyzed for apoptotic cell death. The percentages of Annexin V-positive cells are indicated. (B) Top panel: BM cells from Ews−/− mice (KO, CD45.2; right panel) and their Ews+/+ littermates (WT, CD45.2; left panel) were mixed with an equal number of competitor cells (CD45.1) and transplanted into lethally irradiated recipient (CD45.1.2) mice. Peripheral blood from the transplanted recipients was analyzed for CD45.1/CD45.2 expression by flow cytometry every 4 weeks after transplantation. Bottom panel: representative FACS profile showing donor (Ews−/−, CD45.2) and competitor (CD45.1) contributions at 20 weeks after transplantation in the peripheral blood of recipients. (C) Top panel: recipient mice were killed 20 weeks after transplant. Ews+/+- and Ews−/−-derived LSK cells were stained for SA-β-gal activity. At least 30 cells from 3 random fields were counted in each experiment and the percentage of SA-β-gal–positive cells is shown on the y-axis. *Statistically significant difference (2-tailed Student t test, n = 2, P = .01). Bottom panel: flow cytometric analysis of Ews−/− and WT littermate-derived LSK cells for the expression of SA-β-gal before and after transplantation. The cells were stained with a fluorescent β-galactosidase substrate (C12FDG) and analyzed by flow cytometry.
Figure 5
Figure 5
Immunosenescence phenotypes in Ews−/− mice. (A) Peripheral blood leukocytes from Ews+/+ and Ews−/− recipients were stained with anti-B220 and anti-CD11b antibodies at 4 weeks (top panel) and 5 months (bottom panel) after transplant. (B) One week after immunization with TNP-Ovalbumin, spleen cells were prepared from Ews+/+ and Ews−/− mice, and then challenged with different concentrations of ovalbumin as indicated. Concentrations of the indicated cytokines were determined by enzyme-linked immunosorbent assay. The means were derived from 3 independent experiments: 2-tailed Student t test, n = 3, ***P = .0008.
Figure 6
Figure 6
Ews−/− cells display impaired DNA repair capacity and show a diminished capacity to sustain survival of lethally irradiated animals in serial transplantation. (A) BM mononuclear cells (top panel) and Lin cells (bottom panel) from Ews+/+ and Ews−/− mice were irradiated (2 Gy) in vitro. Cells were collected at the indicated times after IR and stained with anti–γ-H2AX antibodies. The nuclei of cells were visualized with DAPI staining (right panel). The cells containing distinct γ-H2AX foci were counted as positive and reported as a percentage of the total cells counted. The number of γ-H2AX–positive cells were counted from 3 different fields by 2 independent and blinded individuals and plotted with ± SD. An asterisk indicates a statistically significant difference. (2-tailed Student t test, n = 3, *P = .035 and *P = .02). A representative image of γ-H2AX immunofluorescence of Lin cells is shown in the right panel. (B) BM cells (5 × 10⁶) from Ews+/+ and Ews−/− mice were transplanted into lethally irradiated recipient mice. Two months after transplantation, 5 × 10⁶ BM cells derived from these primary recipient mice were pooled and transplanted into secondary recipients, and the same procedure was repeated in tertiary transplantations. The accompanying table indicates the number of surviving recipient mice. Numbers in parentheses denote the numbers of recipient mice used for each group.
Figure 7
Figure 7
Comparative analysis of senescence-associated genes and a limited role of Ews in stromal cells' capacity to support hematopoiesis. (A) Top panel: total RNA was prepared from freshly isolated Ews+/+ and Ews−/− Lin BM cells and then subjected to quantitative PCR analysis. Bottom panel: 5 × 10⁵ BM cells from Ews−/− mice and WT littermates were transplanted into irradiated recipients. Two months after transplantation, LSK cells derived from WT or KO donors in the recipients were sorted and subjected to quantitative PCR analysis. The expression level in WT cells was arbitrarily set to 1. The fold change in expression of each gene was calculated using the ΔΔCt method. An asterisk indicates a statistically significant difference (2-tailed Student t test; *P = .03; **P = .006). (B) Left panel: LSK cells were sorted from Ews−/− and WT littermates and then subjected to quantitative PCR analysis. The expression level in WT cells was arbitrarily set to 1. Right panel: immunoblot analysis of endogenous Ezh2 protein expression in E14.5 fetal liver cell extracts from Ews−/− and WT littermates. (C) Primary BM stromal cells were prepared from Ews+/+ (WT), Ews+/− (HT) and Ews−/− (KO) littermates. Normal BM cells were seeded onto the stroma cells. The CAFC assay was performed as described in “CFC and CAFC assays.”

Similar articles

Cited by

References

    1. Meltzer PS. Is Ewing's sarcoma a stem cell tumor? Cell Stem Cell. 2007;1(1):13–15. - PubMed
    1. Bertolotti A, Bell B, Tora L. The N-terminal domain of human TAFII68 displays transactivation and oncogenic properties. Oncogene. 1999;18(56):8000–8010. - PubMed
    1. Torchia EC, Boyd K, Rehg JE, Qu C, Baker SJ. EWS/FLI-1 induces rapid onset of myeloid/erythroid leukemia in mice. Mol Cell Biol. 2007;27(22):7918–7934. - PMC - PubMed
    1. Matsunobu T, Tanaka K, Nakamura T, et al. The possible role of EWS-Fli1 in evasion of senescence in Ewing's family tumors. Cancer Res. 2006;66(2):803–811. - PubMed
    1. Deneen B, Denny CT. Loss of p16 pathways stabilizes EWS/FLI1 expression and complements EWS/FLI1 mediated transformation. Oncogene. 2001;20(46):6731–6741. - PubMed

Publication types

Substances