. 2011 Jan;22(1):90-103.
doi: 10.1681/ASN.2009121236. Epub 2010 Oct 28.

Blockade of Wnt/β-catenin signaling by paricalcitol ameliorates proteinuria and kidney injury

Affiliations

Blockade of Wnt/β-catenin signaling by paricalcitol ameliorates proteinuria and kidney injury

Weichun He et al. J Am Soc Nephrol. 2011 Jan.

Abstract

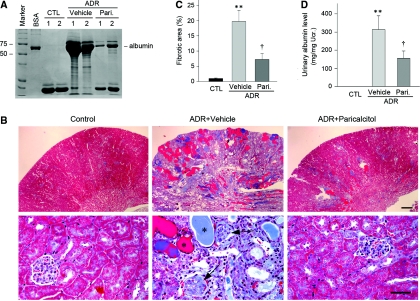
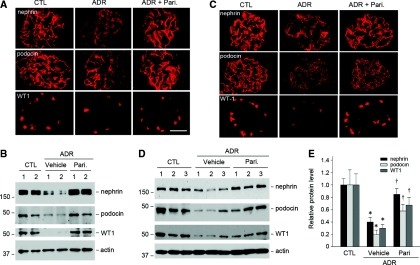
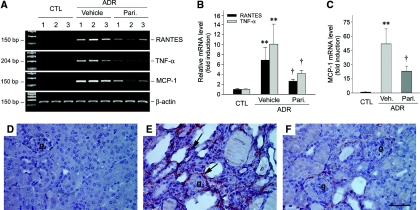
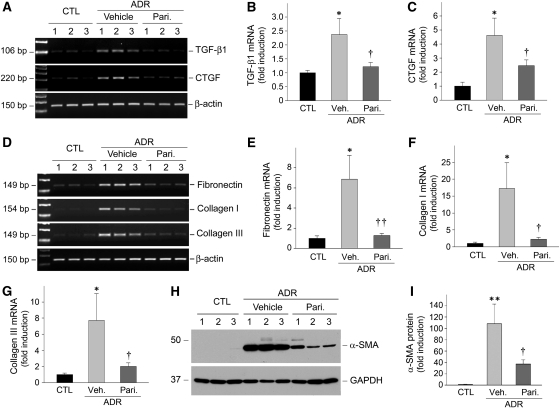
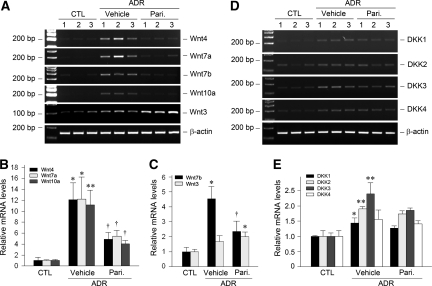
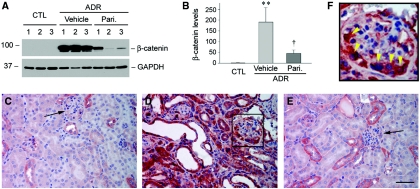
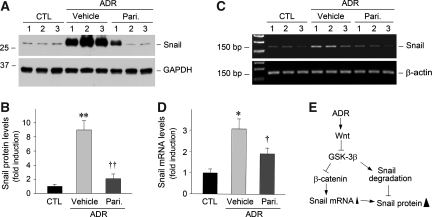
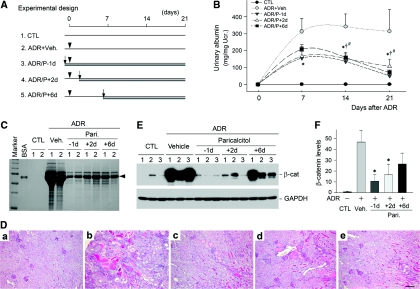
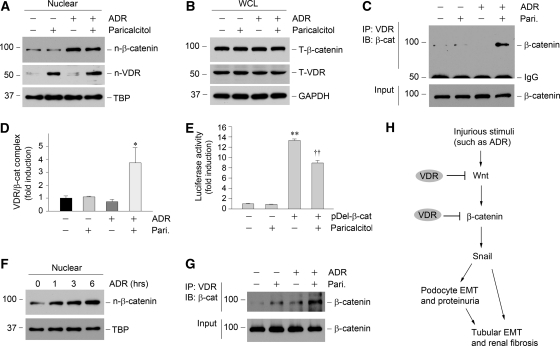
Recent studies implicate Wnt/β-catenin signaling in podocyte dysfunction. Because vitamin D analogs can inhibit β-catenin in other tissues, we tested whether the vitamin D analog paricalcitol could ameliorate podocyte injury, proteinuria, and renal fibrosis in adriamycin (ADR) nephropathy. Compared with vehicle-treated controls, paricalcitol preserved expression of nephrin, podocin, and WT1; prevented proteinuria; and reduced glomerulosclerotic lesions induced by ADR. Paricalcitol also inhibited expression of proinflammatory cytokines, reduced renal infiltration of monocytes/macrophages, hampered activation of renal myofibroblasts, and suppressed expression of the fibrogenic TGF-β1, CTGF, fibronectin, and types I and III collagen. Selective suppression of renal Wnt4, Wnt7a, Wnt7b, and Wnt10a expression after ADR accompanied these renoprotective effects of paricalcitol. Significant upregulation of β-catenin, predominantly in podocytes and tubular epithelial cells, accompanied renal injury; paricalcitol largely abolished this induction of renal β-catenin and inhibited renal expression of Snail, a downstream effector of Wnt/β-catenin signaling. Administration of paricalcitol also ameliorated established proteinuria. In vitro, paricalcitol induced a physical interaction between the vitamin D receptor and β-catenin in podocytes, which led to suppression of β-catenin-mediated gene transcription. In summary, these findings suggest that paricalcitol prevents podocyte dysfunction, proteinuria, and kidney injury in adriamycin nephropathy by inhibiting Wnt/β-catenin signaling.


Figures

Figure 1.
Figure 1.
Paricalcitol ameliorates proteinuria and kidney injury in adriamycin nephropathy. (A) SDS-PAGE analysis shows the abundance and composition of urinary proteins in different groups of mice at 5 weeks after ADR injection. Urine samples after normalization to creatinine were analyzed on SDS-PAGE, with BSA (1 μg) loaded on the adjacent lane. The numbers (1 and 2) indicate each individual, representative animal in a given group. (B) Representative micrographs demonstrate kidney injury at 5 weeks after ADR injection in different groups of mice as indicated. Kidney sections were subjected to Masson-trichrome staining. The asterisks indicate the dilated tubules with proteinous fluid in the lumens. The arrows indicate sclerotic glomeruli. Images with different magnifications were shown. The scale bar in the top panels indicates 250 μm; that in the bottom panels indicates 50 μm. (C) Quantitative determination of kidney fibrotic lesions in different groups at 5 weeks after ADR injection. **P < 0.01 versus normal controls; †P < 0.05 versus ADR alone (n = 5 to 8). (D) Urinary albumin levels in mice at 7 days after ADR injection. Urinary albumin was expressed as mg/mg creatinine. **P < 0.01 versus normal controls; †P < 0.05 versus ADR alone (n = 6). CTL, control; Pari., paricalcitol.
Figure 2.
Figure 2.
Paricalcitol preserves nephrin, podocin, and WT1 expression and prevents podocyte injury in vivo. (A and C) Representative micrographs show the abundance and distribution of nephrin, podocin, and WT1 proteins in the glomeruli of different groups of mice as indicated at 5 weeks (A) or 1 week (C) after ADR injection, respectively. Scale bar, 20 μm. (B and D) Western blot analyses demonstrate that paricalcitol preserved nephrin, podocin, and WT1 expression at 5 weeks (B) or 1 week (D) after ADR injection, respectively. Glomerular lysates from different groups of mice were immunoblotted with specific antibodies against nephrin, podocin, WT1, and actin, respectively. The numbers (1, 2, and 3) indicate each individual glomerular preparation isolated from a pool of two animals. (E) Quantitative determination of the relative abundances of nephrin, podocin, and WT1 in different groups at 1 week after ADR injection. *P < 0.05 versus normal controls; †P < 0.05 versus ADR alone (n = 3).
Figure 3.
Figure 3.
Paricalcitol inhibits proinflammatory cytokines expression and reduces renal infiltration of monocytes/macrophages. (A) Representative RT-PCR results show renal mRNA expression of RANTES, TNF-α, and MCP-1 at 5 weeks after ADR injection in different groups of mice as indicated. The numbers (1, 2, and 3) denote each individual animal in a given group. (B and C) Graphic presentation shows the relative mRNA levels of RANTES, TNF-α (B), and MCP-1 mRNA levels (C) determined by quantitative, real-time RT-PCR in different groups. Relative mRNA levels were determined after normalization with β-actin and expressed as fold induction over controls. The data are expressed as the means ± SEM (n = 5 to 8). **P < 0.01 versus normal controls. †P < 0.05 versus ADR alone. (D through F) Representative micrographs show renal infiltration of F4/80-positive myeloid cells including monocytes/macrophages and dendritic cells at 5 weeks after ADR injection in different groups of mice as indicated. The arrows indicate F4/80-positive cells. (D) Normal control. (E) ADR alone. (F) ADR plus paricalcitol. Scale bar, 50 μm. CTL, control; Pari., paricalcitol; g, glomeruli.
Figure 4.
Figure 4.
Paricalcitol inhibits renal expression of TGF-β1, CTGF, and matrix genes and reduces myofibroblast activation after ADR injury. (A through C) Representative RT-PCR results (A) and graphic presentation (B and C) showed the mRNA expression of profibrotic cytokines TGF-β1 and CTGF in different groups of mice as indicated at 5 weeks after ADR injection. The numbers (1, 2, and 3) denote each individual animal in a given group. (D through G) Representative RT-PCR (D) and graphic presentation of the mRNA levels of interstitial matrix genes fibronectin (E), type I (F), and type III collagen (G) in different groups of mice. The relative mRNA levels were determined by quantitative real-time RT-PCR analysis, calculated after normalization with β-actin, and expressed as fold induction over normal controls. (H and I) Western blot analyses show the α-SMA protein expression in different groups of mice as indicated at 5 weeks after ADR injection. Representative Western blots (H) and quantitative determination of α-SMA protein levels (I) are presented. The data are expressed as the means ± SEM (n = 5 to 8). *P < 0.05, **P < 0.01 versus normal controls; †P < 0.05, ††P < 0.01 versus ADR alone. CTL, control; Pari., paricalcitol; Veh., vehicle.
Figure 5.
Figure 5.
The expression of Wnt genes is selectively inhibited by paricalcitol in the kidney after ADR injury. (A) Representative RT-PCR results show renal mRNA expression of various Wnt genes in different groups of mice as indicated at 5 weeks after ADR injection. The numbers (1, 2, and 3) denote each individual animal in a given group. (B and C) Graphic presentation of various Wnts mRNA levels in different groups. Relative mRNA levels were determined after normalization with β-actin and expressed as fold induction over normal controls. (D and E) RT-PCR results show renal expression of various DKK genes in different groups of mice as indicated. Relative mRNA levels were determined after normalization with β-actin and expressed as fold induction over normal controls (E). The data are expressed as the means ± SEM (n = 5 to 8). *P < 0.05 versus normal controls; **P < 0.01 versus normal controls; †P < 0.05 versus ADR alone. CTL, control; Pari., paricalcitol.
Figure 6.
Figure 6.
Paricalcitol blocks renal β-catenin accumulation and activation after ADR injury. (A and B) Western blot analyses show renal β-catenin protein abundance at 5 weeks after ADR injection in different groups of mice as indicated. Whole-kidney lysates were immunoblotted with specific antibodies against β-catenin and GAPDH, respectively. Representative Western blots (A) and quantitative determination of β-catenin protein levels (B) are presented. The numbers (1, 2, and 3) denote each individual animal in a given group. The data are expressed as the means ± SEM (n = 5 to 8). **P < 0.01 versus normal controls; †P < 0.05 versus ADR alone. (C through F) Representative micrographs show β-catenin protein expression and localization in the kidneys at 5 weeks after ADR injection in different groups of mice. The arrows indicate glomeruli. (C) Normal controls. (D) ADR. (E) ADR plus paricalcitol. (F) Enlarged image of the boxed area in D. The arrowheads (yellow) indicate β-catenin–positive podocytes. Scale bar, 50 μm. CTL, control; Pari., paricalcitol.
Figure 7.
Figure 7.
Paricalcitol suppresses renal Snail expression after ADR injury. (A and B) Western blot analyses show renal Snail protein expression at 5 weeks after ADR injection in different groups of mice as indicated. Representative Western blots (A) and quantitative determination of Snail protein levels (B) are presented. The numbers (1, 2, and 3) denote each individual animal in a given group. The data are expressed as the means ± SEM (n = 5 to 8). **P < 0.01 versus normal controls; ††P < 0.01 versus ADR alone. (C and D) RT-PCR results show renal Snail mRNA expression in different groups of mice as indicated. Snail mRNA levels were determined by real-time RT-PCR and expressed as fold induction over normal controls after normalization with β-actin. The data are expressed as the means ± SEM (n = 5 to 8). *P < 0.05 versus normal controls; †P < 0.05 versus ADR alone. (E) Diagram shows the putative signaling pathways leading to Snail mRNA and protein induction in ADR nephropathy. CTL, control; Pari., paricalcitol.
Figure 8.
Figure 8.
Paricalcitol induces reversal of an established proteinuria in ADR nephropathy. (A) Diagram shows the experimental design. The arrows indicate the starting point of daily injections of paricalcitol, whereas heavy arrowheads denote the single injection of ADR. (B) Urinary albumin levels in different groups as indicated. Mouse urine was collected weekly after ADR injection, and urinary albumin level was expressed as mg/mg creatinine. *P < 0.05 group 3 versus group 2; †P < 0.05 group 4 versus group 2; #P < 0.05 group 5 versus group 2 (n = 5 to 6). (C) SDS-PAGE shows the abundance and composition of urinary proteins in different groups of mice at 21 days after ADR injection. Urine samples after normalization to creatinine were analyzed on SDS-PAGE, with BSA (1 μg) loaded on the adjacent lane. The numbers (1 and 2) indicate each individual, representative animal in a given group. (D) Representative micrographs demonstrate kidney histology in different groups of mice. Kidney sections were stained with periodic acid-Schiff reagent. (Panel a) Control. (Panel b) ADR alone. (Panel c) ADR plus paricalcitol at −1 day. (Panel d) ADR plus paricalcitol at + 2 days. (Panel e) ADR plus paricalcitol at + 6 days. Scale bar, 100 μm. (E and F) Western blot analyses show renal β-catenin protein abundance at 3 weeks after ADR injection in different groups of mice as indicated. Whole-kidney lysates were immunoblotted with specific antibodies against β-catenin and GAPDH, respectively. Representative Western blots (E) and quantitative determination of β-catenin protein levels (F) are presented. The numbers (1, 2, and 3) denote each individual animal in a given group. The data are expressed as the means ± SEM (n = 5 to 6). *P < 0.05 versus ADR alone. CTL, control; Veh., vehicle; Pari., paricalcitol.
Figure 9.
Figure 9.
Paricalcitol induces VDR to interact with β-catenin and sequestrate its transcription activity. (A and B) Western blot analyses show the nuclear and total cellular β-catenin and VDR abundances after various treatments as indicated. Mouse podocytes were pretreated without or with paricalcitol (Pari., 10−7 m) for 1 hour and then incubated with ADR (10 μg/ml) for an additional 1 hour. Nuclear protein preparation (A) and whole cell lysates (WCL) (B) were immunoblotted (IB) with antibodies against β-catenin and VDR, respectively. TBP and GAPDH were used for normalization of nuclear protein and WCL, respectively. n, nuclear; T, total. (C) Coimmunoprecipitation (IP) reveals that paricalcitol induced VDR/β-catenin complex formation in podocytes. Cell lysates were prepared after various treatments as indicated and immunoprecipitated with specific antibody against VDR, followed by immunoblotting for β-catenin. Cellular β-catenin levels after various treatments were assessed by routine Western blot analysis of WCLs. (D) Graphic presentation shows the relative abundance of VDR/β-catenin complex after various treatments as indicated. The data are expressed as the means ± SEM (n = 3). *P < 0.05 versus controls. (E) Paricalcitol inhibits β-catenin–mediated gene transcription. Podocytes were transfected with TOP-flash reporter plasmid in the absence or presence of stabilized β-catenin expression vector (pDel-β-cat). Twenty-four hours after transfection, the cells were incubated with or without paricalcitol (10−7 m). Relative luciferase was reported as the means ± SEM (n = 3). **P < 0.01 versus controls; ††P < 0.01 versus pDel-β-cat alone. (F) ADR also induces β-catenin nuclear translocation in proximal tubular epithelial cells (HKC-8). HKC-8 cells were treated with ADR (10 μg/ml) for different periods of time as indicated. Nuclear β-catenin levels were assessed by immunoblotting of nuclear lysates with antibodies against β-catenin and TBP, respectively. (G) Paricalcitol also induces VDR/β-catenin complex formation in proximal tubular epithelial cells (HKC-8). The cells were pretreated with paricalcitol for 1 hour, followed by incubation with ADR (10 μg/ml) for 1 hour. (H) Schematic diaphragm shows that paricalcitol, via VDR, inhibits Wnt expression and blocks β-catenin–mediated gene transcription.

Similar articles

Cited by

References

    1. Shankland SJ: The podocyte's response to injury: Role in proteinuria and glomerulosclerosis. Kidney Int 69: 2131–2147, 2006 - PubMed
    1. Wiggins RC: The spectrum of podocytopathies: A unifying view of glomerular diseases. Kidney Int 71: 1205–1214, 2007 - PubMed
    1. Patrakka J, Tryggvason K: New insights into the role of podocytes in proteinuria. Nat Rev Nephrol 5: 463–468, 2009 - PubMed
    1. Abbate M, Zoja C, Remuzzi G: How does proteinuria cause progressive renal damage? J Am Soc Nephrol 17: 2974–2984, 2006 - PubMed
    1. Zandi-Nejad K, Eddy AA, Glassock RJ, Brenner BM: Why is proteinuria an ominous biomarker of progressive kidney disease? Kidney Int Suppl S76–S89, 2004 - PubMed

Publication types

MeSH terms