. 2010 Nov 19;330(6007):1108-12.
doi: 10.1126/science.1195298. Epub 2010 Oct 28.

Calcium-permeable AMPA receptor dynamics mediate fear memory erasure

Affiliations

Calcium-permeable AMPA receptor dynamics mediate fear memory erasure

Roger L Clem et al. Science. .

Abstract

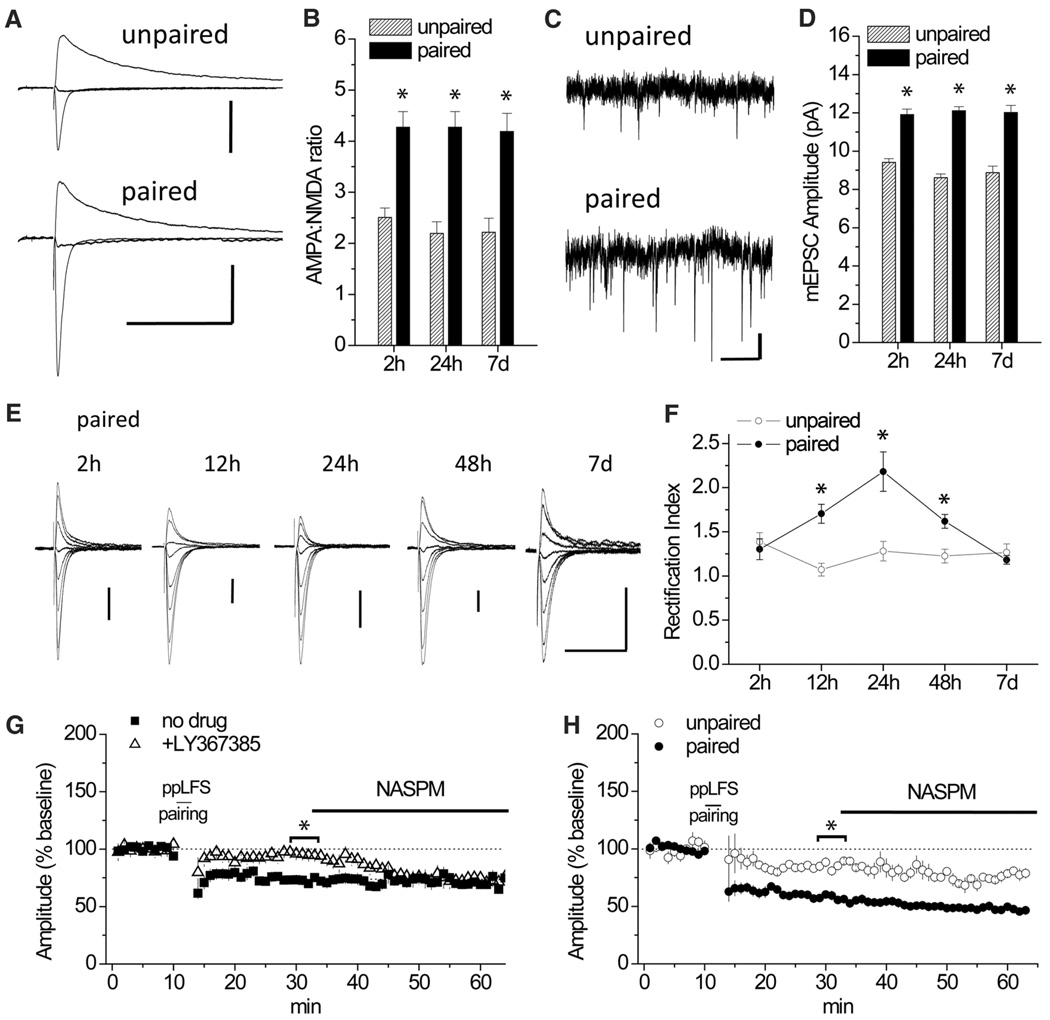
Traumatic fear memories can be inhibited by behavioral therapy for humans, or by extinction training in rodent models, but are prone to recur. Under some conditions, however, these treatments generate a permanent effect on behavior, which suggests that emotional memory erasure has occurred. The neural basis for such disparate outcomes is unknown. We found that a central component of extinction-induced erasure is the synaptic removal of calcium-permeable α-amino-3-hydroxyl-5-methyl-4-isoxazole-propionate receptors (AMPARs) in the lateral amygdala. A transient up-regulation of this form of plasticity, which involves phosphorylation of the glutamate receptor 1 subunit of the AMPA receptor, defines a temporal window in which fear memory can be degraded by behavioral experience. These results reveal a molecular mechanism for fear erasure and the relative instability of recent memory.


Figures

Fig. 1
Fig. 1
Fear conditioning alters AMPAR subunit composition and LTD at thalamo-LA synapses. Training entailed six CSs (auditory tones) and USs (footshocks) delivered in a paired or unpaired configuration. (A) EPSCs at membrane holding potential (Vh) = −70, 0, and +40 mV, scaled to peak amplitude at +40 mV, at 24 hours after conditioning. Scale bars, 100 pA × 200 ms. (B) AMPA:NMDA ratio as a function of time after conditioning. *P < 0.01 analysis of variance (ANOVA); Tukey’s post-hoc test for paired (n = 11 to 12 cells) versus unpaired (n = 7 to 10 cells) configuration. h, hours; d, days. (C) mEPSCs at 24 hours after conditioning. Scale bar, 5 pA × 1 s. (D) mEPSC amplitude as a function of time after conditioning. *P < 0.0001 ANOVA; Tukey’s posthoc paired versus unpaired cells. (E) AMPAR-EPSCs after paired conditioning at Vh = −70, −60, −40, −20, 0, +20, +40, and +50 mV, normalized to peak amplitude at −70mV. Scale bars, 50 pA × 40 ms. (F) Rectification index. *P < 0.05 ANOVA; Tukey’s post-hoc for paired (n = 6 to 9 cells) versus unpaired (n = 5 to 7 cells) configuration. (G) In slices from naïve mice, LTD induction by ppLFS pairing (with a 3-Hz paired-pulse stimulation at a 50-ms interpulse interval, for 3 min at −50 mV) without drug (n = 6 cells) or in the presence of LY367385 (100 µM, n = 6 cells), followed by normalization of EPSC amplitude by NASPM. (H) Enhanced LTD 24 hours after conditioning. Paired (n = 6 cells) and unpaired (n = 5 cells) configurations are shown. *P < 0.05, Student’s t test.
Fig. 2
Fig. 2
Reconsolidation update performed soon after fear conditioning (FC) erases fear. (A) Experimental groups. Ret, retrieval; Ext, extinction. (B and C) CS-evoked freezing during conditioning and extinction. (D to F) Freezing was averaged for the first and last four trials of extinction. Spontaneous recovery (Spont Rec) and renewal were assessed by test comparison with the last four trials of extinction. Repeated-measures ANOVA revealed a significant group × test interaction in (D) [F3,39 = 10.1, P < 0.0001 (n = 7 to 8 mice)] and (E) [F3,36 = 9.6, P < 0.0001 (n = 7 to 8 mice)] but not in (F) [F3,36 = 0.34, P = 0.80 (n = 6 to 8 mice)]. *P < 0.001, Tukey’s post-hoc comparison with the last four trials. #P < 0.0001. (G) Effect of systemic AIDA 1 hour before retrieval extinction (Ret-Ext). Repeated-measures ANOVA, treatment × test: F3,48 = 4.95, P < 0.01 (n = 8 to 10 mice). *P < 0.01, Tukey’s post-hoc comparison with the last four trials. #P < 0.01.
Fig. 3
Fig. 3
Reconsolidation update dampens amygdala transmission via removal of synaptic CP-AMPARs. (A) Treatment groups for synaptic physiology. (B) Freezing during spontaneous recovery and renewal tests 2 hours after extinction. *P < 0.01 ANOVA, Tukey’s post-hoc test (n = 6 mice each). (C to F) AMPAR properties 2 hours after extinction, including AMPA:NMDA ratio [(C), n = 7 to 9 cells], AMPAR-mEPSC amplitude [(D), n = 8 to 18 cells], AMPAR-EPSC rectification index [(E), n = 7 to 13 cells], and AMPAR-EPSC sensitivity to NASPM [(F), n = 5 to 6 cells]. *P < 0.01 ANOVA, Tukey’s post-hoc test. Scale bars for (C) to (E) are as follows: (C) 100 pA × 40 ms, (D) 5 pA × 20 ms, (E) 50 pA × 40 ms. (F) Representative traces from time points a and b; scale bars, 100 pA × 20 ms. (G) ppLFS pairing LTD followed by test for CP-AMPARs by NASPM (50 µM). *P < 0.01 ANOVA followed by Tukey’s post-hoc comparison of retrieval with context-only and no-retrieval. Representative traces from time points a, b, and c are shown; scale bars, 100 pA × 20 ms.
Fig. 4
Fig. 4
GluA1 phosphorylation regulates LTD and fear erasure by controlling synaptic CP-AMPAR levels. (A) AMPAR-EPSCs at Vh = −70, −60, −40, −20, 0, +20, +40, and +50 mV, scaled to peak amplitude at −70 mV, in homozygous GluA1 S831A mice (n = 6 each) and S845A knockin mutant mice (n = 6 to 8) 24 hours after conditioning. Scale bars, 100 pA × 40 ms. (B) Rectification index 24 hours after conditioning. *P < 0.02, Student’s t test. (C to F) For S845A mutants 24 hours after conditioning, the NASPM sensitivity of AMPAR-EPSCs [(C), n = 5 to 6 cells], the AMPA:NMDA ratio [(D) and (E), n = 9 to 14 cells], and the AMPAR-mEPSC amplitude [(F), n = 7 to 8 cells] are shown. *P < 0.001, Student’s t test. Scale bars in (D), 100 pA × 200 ms. (G) ppLFS pairing in S845A knockin mice 2 hours after reconsolidation update on day 1 (as in Fig. 2). (H and I) Spontaneous recovery and renewal in S845A knockin mice and wild-type littermates after reconsolidation update. (H) Repeated measures ANOVA, group × test interaction: for the wild type, F3,33 = 3.29, P < 0.05 (n = 5 to 8 mice); for S845A mice, F3,33 = 1.69, P = 0.19 (n = 5 to 8 mice). (I) Repeated measures ANOVA, group × test interaction: for the wild type, F3,36 = 4.72, P < 0.01 (n = 6 to 8 mice); for S845A mice, F3,36 = 0.54, P = 0.66 (n = 6 to 8 mice). *P < 0.01 Tukey’s post-hoc comparison with the last four trials. #P < 0.01.

References

    1. Gale GD, et al. J. Neurosci. 2004;24:3810. - PMC - PubMed
    1. McNally RJ. Clin. Psychol. Rev. 2007;27:750. - PubMed
    1. Herry C, et al. Eur. J. Neurosci. 2010;31:599. - PubMed
    1. Pape HC, Pare D. Physiol. Rev. 2010;90:419. - PMC - PubMed
    1. Gogolla N, Caroni P, Lüthi A, Herry C. Science. 2009;325:1258. - PubMed

Publication types