. 2011 Jan;300(1):G82-98.
doi: 10.1152/ajpgi.00245.2010. Epub 2010 Oct 28.

Physiological relevance of cell-specific distribution patterns of CFTR, NKCC1, NBCe1, and NHE3 along the crypt-villus axis in the intestine

Affiliations

Physiological relevance of cell-specific distribution patterns of CFTR, NKCC1, NBCe1, and NHE3 along the crypt-villus axis in the intestine

Robert L Jakab et al. Am J Physiol Gastrointest Liver Physiol. 2011 Jan.

Abstract

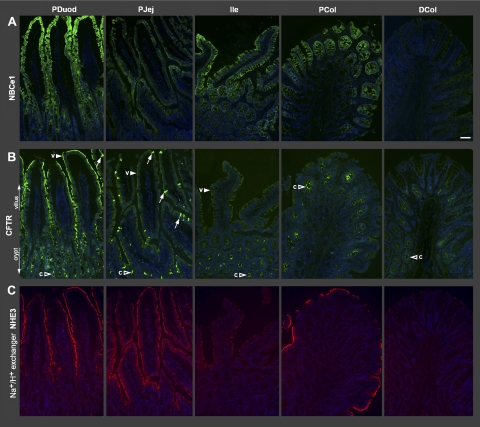
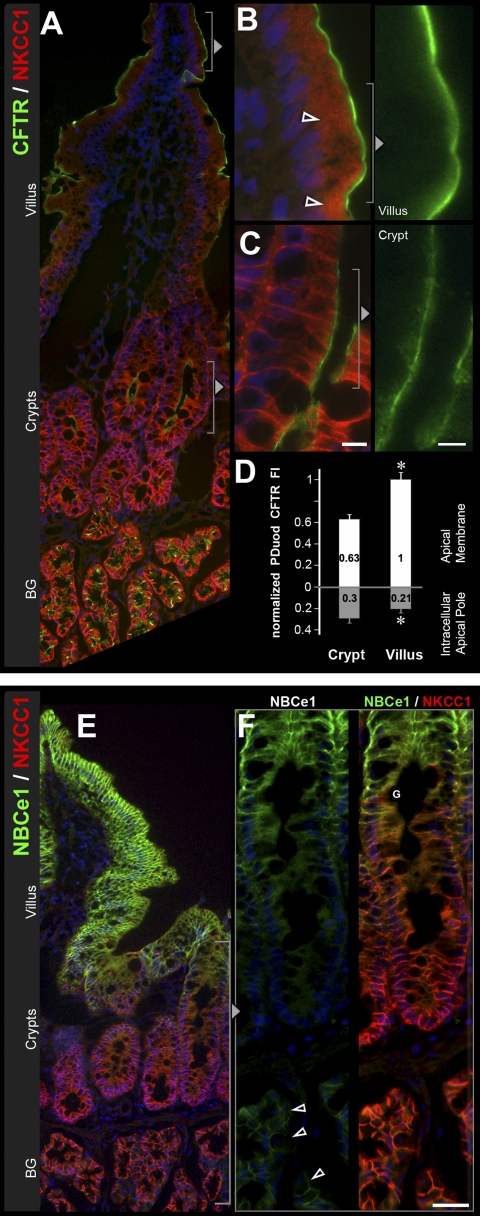
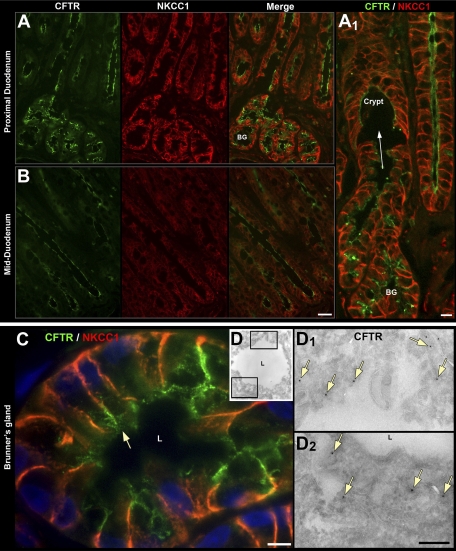
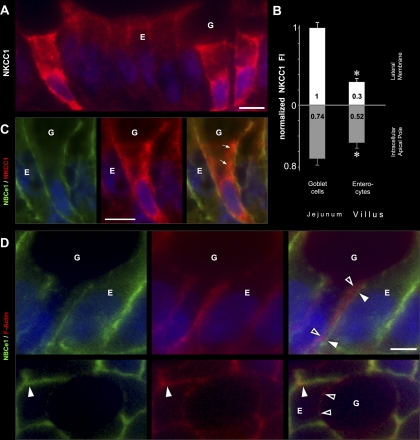
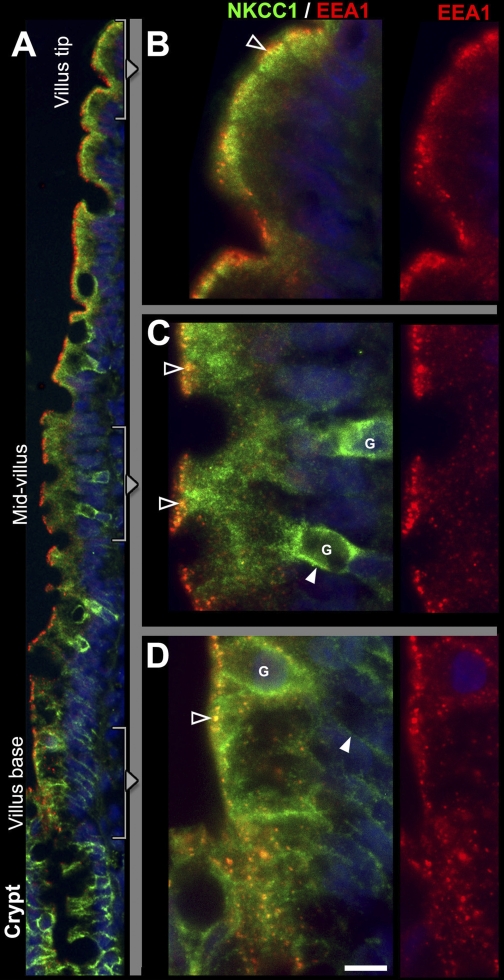
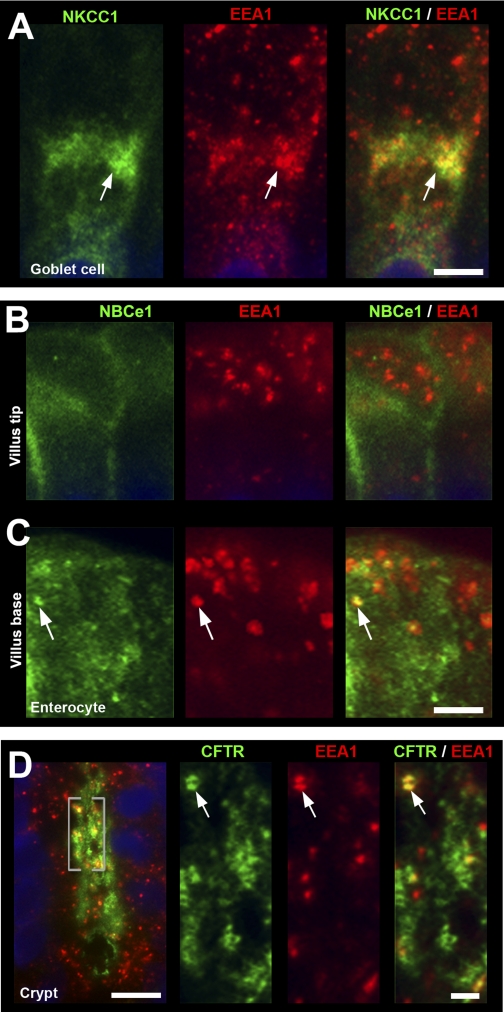
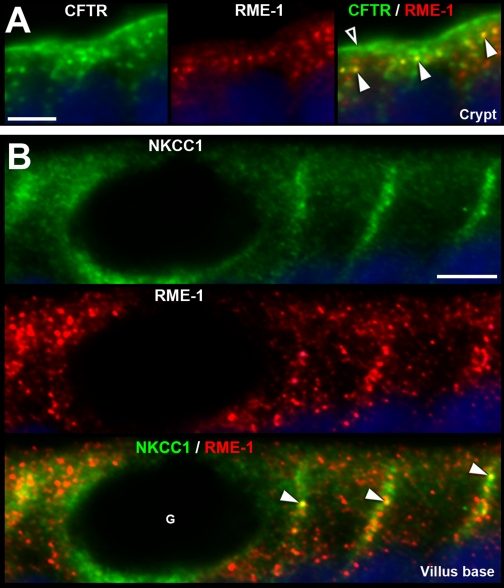
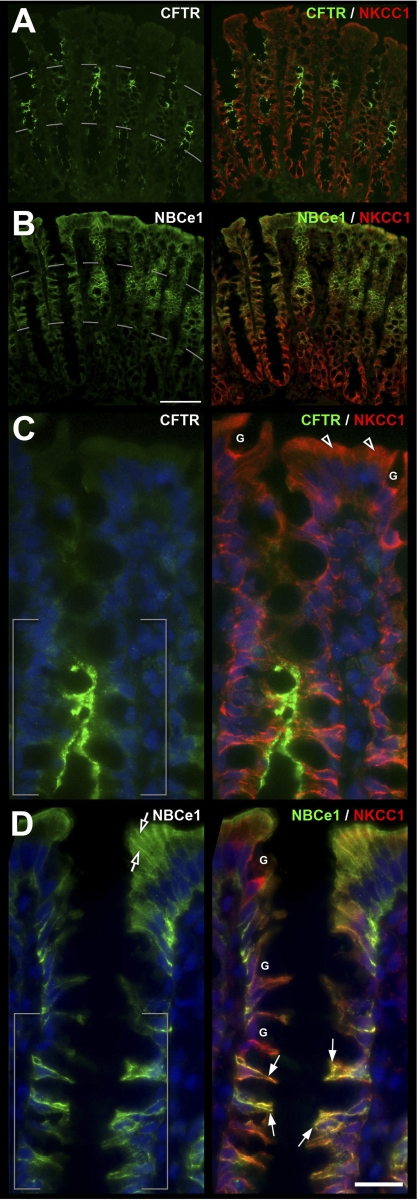
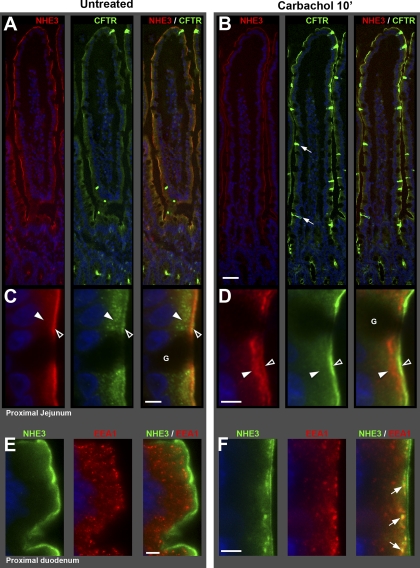
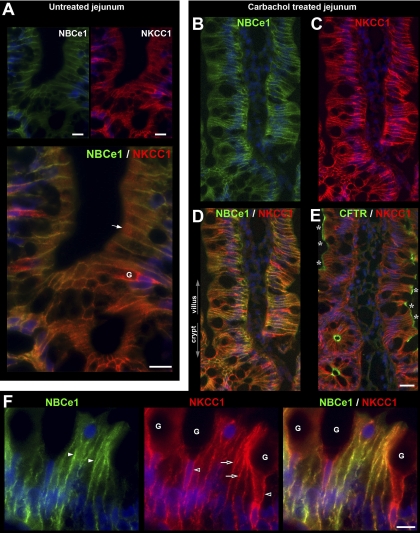
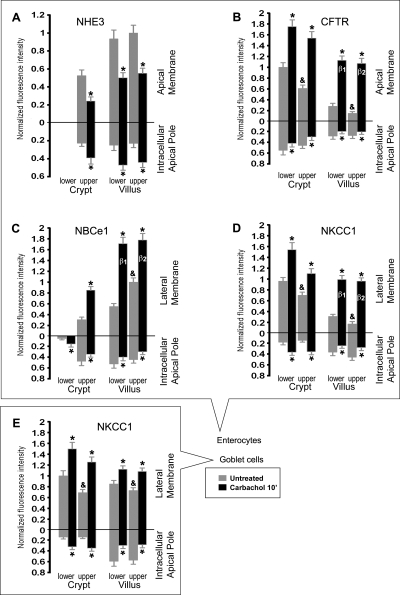
We examined the cell-specific subcellular expression patterns for sodium- and potassium-coupled chloride (NaK2Cl) cotransporter 1 (NKCC1), Na(+) bicarbonate cotransporter (NBCe1), cystic fibrosis transmembrane conductance regulator (CFTR), and Na(+)/H(+) exchanger 3 (NHE3) to understand the functional plasticity and synchronization of ion transport functions along the crypt-villus axis and its relevance to intestinal disease. In the unstimulated intestine, all small intestinal villus enterocytes coexpressed apical CFTR and NHE3, basolateral NBCe1, and mostly intracellular NKCC1. All (crypt and villus) goblet cells strongly expressed basolateral NKCC1 (at approximately three-fold higher levels than villus enterocytes), but no CFTR, NBCe1, or NHE3. Lower crypt cells coexpressed apical CFTR and basolateral NKCC1, but no NHE3 or NBCe1 (except NBCe1-expressing proximal colonic crypts). CFTR, NBCe1, and NKCC1 colocalized with markers of early and recycling endosomes, implicating endocytic recycling in cell-specific anion transport. Brunner's glands of the proximal duodenum coexpressed high levels of apical/subapical CFTR and basolateral NKCC1, but very low levels of NBCe1, consistent with secretion of Cl(-)-enriched fluid into the crypt. The cholinergic agonist carbachol rapidly (within 10 min) reduced cell volume along the entire crypt/villus axis and promoted NHE3 internalization into early endosomes. In contrast, carbachol induced membrane recruitment of NKCC1 and CFTR in all crypt and villus enterocytes, NKCC1 in all goblet cells, and NBCe1 in all villus enterocytes. These observations support regulated vesicle traffic in Cl(-) secretion by goblet cells and Cl(-) and HCO(3)(-) secretion by villus enterocytes during the transient phase of cholinergic stimulation. Overall, the carbachol-induced membrane trafficking profile of the four ion transporters supports functional plasticity of the small intestinal villus epithelium that enables it to conduct both absorptive and secretory functions.


Figures

Fig. 1.
Fig. 1.
Distribution patterns of CFTR, Na+ bicarbonate cotransporter (NBCe1), and Na+/H+ exchanger 3 (NHE3) along the proximal-distal axis of rat intestine. Tissues from intestinal segments were embedded using tissue arrays. Sections were processed and imaged under standard conditions as described in materials and methods. Low-magnification images show the distribution of NBCe1 (green) (A), CFTR (green) (B), and NHE3 (red) (C). CFTR and NHE3 images were taken from a section doubled labeled for CFTR/NHE3; NBCe1 images are from a neighboring section. Villus (arrowheads, v), crypt (open arrowheads, c), CFTR High Expresser cells (arrows). PDuod, proximal duodenum; PJej, proximal jejunum; Ile, ileum; PCol, proximal colon; DCol, distal colon; Scale bar: AC: 100 μm.
Fig. 2.
Fig. 2.
Distribution of CFTR, the sodium- and potassium-coupled chloride cotransporter 1 (NKCC1), and NBCe1 along the crypt-villus axis of proximal duodenum. Sections of rat proximal duodenum were double-labeled for CFTR (green) and NKCC1 (red) or NBCe1 (green) and NKCC1 (red). A: lower-power magnification shows distribution of CFTR and NKCC1 from the villus tip to the submucosal Brunner's glands (BG). Higher magnification of villus tip (B) shows CFTR and intracellular NKCC1 (open arrowheads) or (far right) CFTR alone. C: basolateral and some intracellular NKCC1 label in more superficial crypt cells. D: normalized CFTR fluorescence intensity (FI) levels in the crypt and villus epithelium. Data shown are means ± SE (n = 8). *P < 0.001; significantly different by Student's t-test. E: low-magnification image of NBCe1 (green) and NKCC1 (red) distribution from villus tip to the submucosal BG. F: high-magnification images of NBCe1 (left) and NBCe1/NKCC1 (right) in the crypt and BG show gradients of NBCe1 and NKCC1 expression. Weak NBCe1 label (open arrowheads) and strong NKCC1 are identified on the basolateral membrane of the submucosal BG cells. Goblet cells (G). Scale bars: B and C, left: 10 μm; C (right): 5 μm; F: 25 μm.
Fig. 3.
Fig. 3.
Distribution of CFTR and NKCC1 in the submucosal Brunner's glands (BG) and crypt epithelium of proximal and mid-duodenum. Distribution of CFTR (green), NKCC1 (red), and merged images in crypt (A and B) and BG in proximal duodenum (A) and mid-duodenum (B). A1: high-magnification image of site of confluence (arrow) of BG into the crypt lumen (C) High-power light micrograph of cross section of BG double labeled for NKCC1 (red) and CFTR (green) arrow, apical CFTR staining, L, lumen. D: electron micrograph of ultrathin cryosection of rat BG labeled with anti-CFTR antibody and protein A gold. D1, D2: enlarged images from D. Immunogold labeling for CFTR (arrows) on the apical membrane and subapical structures beneath the lumen (L). Scale bars: A and B, 50 μm; A1: 10 μm; C, 10 μm; D, 0.25 μm.
Fig. 4.
Fig. 4.
Subcellular distribution of NKCC1 and NBCe1 in villus enterocytes and goblet cells Villus sections of proximal jejunum were double labeled to detect NKCC1 (red), NBCe1 (green), and F-actin (red) using rhodamine-phalloidin. A: prominent membrane and intracellular NKCC1 staining in three goblet cells (G) among enterocytes (E). B: normalized NKCC1 fluorescence intensity (FI) at the lateral membrane and the intracellular apical pole in villus goblet cells vs. villus enterocytes. NKCC1 lateral membrane FI in enterocytes is 0.30 relative to goblet cells. Lower and upper villus cell data were combined; the individual cell group data are presented in Fig. 11E. Data shown are expressed as means ± SE. *P < 0.001; significantly different by Student's t-test. C: high-magnification image of a goblet cell (G) and neighboring enterocyte (E) double labeled for NBCe1 (green) and NKCC1 (red) and merged image. Intracellular NKCC1 in goblet cells (arrows) D: high-magnification views of double label for NBCe1/F-actin of duodenal villus enterocyte (E) and neighboring goblet cell (G) Side views (top) and en face views (bottom) show NBCe1 (green) colocalization (arrowheads) with F-Actin (red) of the enterocyte (E) but not the goblet (G) cell membrane (open arrowheads). Scale bars: A and C, 10 μm; D, 5 μm.
Fig. 5.
Fig. 5.
Subcellular distribution patterns of NKCC1 and EEA1-positive vesicles along the crypt-villus axis in jejunum. Sections from rat jejunum were double labeled to detect NKCC1 (green) and the early endosomal marker EEA-1 (red). A: low-power micrograph of NKCC1/EEA1 staining patterns along the crypt-villus axis. In goblet cells (G) in the mid-villus (enlarged in C) and villus base (enlarged in D), NKCC1 label is partially on the basolateral membrane (open arrowheads in C), and partially intracellular. NKCC1 is also detected in all enterocytes along the villus: at the villus base (D), enterocyte labeling is basolateral (arrowhead), but in the mid-villus (C) and villus-tip region (B), enterocyte labeling is completely intracellular. Some of the apical NKCC1 in enterocytes appear to colocalize with EEA1 (yellow; open arrowheads). Scale bar: B–D, 10 μm.
Fig. 6.
Fig. 6.
Subcellular distribution of NKCC1, NBCe1, and CFTR in EEA-1 positive compartments in enterocytes and goblet cells. Cryosections of proximal jejunum were double labeled with antibodies to the early endosome marker EEA1 (red) and NKCC1 (green), NBCe1 (green), or CFTR (green). A: high-magnification image of a goblet cell from the midvillus region shows intracellular staining for NKCC1 (green, arrow) and EEA1 (red, arrow) and merged image NKCC1/EEA1 colocalization (yellow, arrow). B and C: distribution of NBCe1 (green) and EEA1 (red) in enterocytes at the villus tip (B) and the villus base (C). NBCe1 staining is both membrane bound and found in EEA1-positive endosomes (arrows). D: subcellular distribution of CFTR (green) and EEA1 (red) in a jejunal crypt. High-magnification images of the highlighted region (brackets) of CFTR (green) EEA-1 (red) and merged image of EEA-1/CFTR colabel (yellow, arrows) Scale bars: AD: 10 μm; enlarged insets in D: 5 μm.
Fig. 7.
Fig. 7.
Subcellular distribution of CFTR and NKCC1 in recycling endosomes in enterocytes. Sections of proximal jejunum were double labeled for CFTR (green) or NKCC1 (green) and the recycling endosome marker RME-1 (red). A: high-magnification images of the apical portion of a crypt show CFTR in the apical brush border (open arrowhead) and in subapical vesicles, some of which appear to colocalize with RME-1 in the subapical domain (yellow, arrowheads). B: at the villus base, NKCC1 (green) labeling is depicted in a goblet cell (G) and neighboring enterocytes. NKCC1 appears to colocalize with RME-1 recycling endosomes (yellow, arrowheads) near the lateral membrane of enterocytes (yellow, arrowheads). Scale bars: A and B, 5 μm.
Fig. 8.
Fig. 8.
CFTR, NBCe1, and NKCC1 distribution in the proximal colon. A and B: low-magnification images of the crypt-surface epithelium double labeled for CFTR (green) or NBCe1 (green) and NKCC1 (red) shows gradients of expression. C and D: higher-magnification image of the upper two-thirds of crypt and surface epithelium shows distribution of CFTR, NBCe1, and NKCC1 in enterocytes (arrows) juxtaposed to NKCC1 expressing goblet cells (G). CFTR (C) and NBCe1 (D) appear coexpressed in the middle third crypt region (brackets). NKCC1 (open arrowheads) and NBCe1 (open arrows) staining in the upper third of the crypt and surface epithelium Scale bar: A and B: 100 μm; C and D: 25 μm.
Fig. 9.
Fig. 9.
Carbachol-induced redistribution of NHE3 and CFTR in rat jejunum and duodenum. Rat proximal jejunum and proximal duodenum were treated with carbachol (CCh) for 10 min. Tissue processing and imaging were standardized (see materials and methods). A and B: NHE3 (red), CFTR (green), and NHE3/CFTR merged image taken from the villus tip to the crypts in untreated (A) and CCh-treated (B) jejunum. Small arrows point to CFTR High Expresser (CHE) cells (green). C and D: high-magnification images of apical domain of villus section from A and B. Apical brush border (open arrowheads) and subapical (solid arrowheads) localization patterns of NHE3 (red) and CFTR (green) in untreated (C) and CCh-treated (D) jejunum. Goblet cells (G). E and F: high-magnification images of villus section from proximal duodenum of untreated (E) and CCh-treated (F) double labeled for NHE3 (green) and the early endosome marker EEA1 (red); arrows denote NHE3-EEA-1 colocalization in punctate structures (yellow) below the apical brush border. Scale bars: A and B, 100 μm; CF, 5 μm.
Fig. 10.
Fig. 10.
Acute carbachol-induced trafficking of CFTR, NKCC1, and NBCe1 in the jejunum. Rat jejunum was treated with carbachol (CCh) for 10 min, and tissue sections were double labeled for NBCe1 (green) or CFTR (green), and NKCC1 (red). A: images from untreated jejunum. Top: lower-magnification images of single labeling for NBCe1 and NKCC1. Bottom: enlarged merged image from superficial crypts and villus base. NKCC1 label appears largely intracellular (arrow). BF: images of CCh treated jejunum. NBCe1 label (B), NKCC1 label (C), and merged image of NBCE1/NKCC1 double label (D). E: Neighboring section double labeled for CFTR and NKCC1. Asterisks indicate increased apical CFTR. F: high-magnification images of villus section from CCh-treated tissues double labeled for NBCe1 (green), NKCC1 (red), and merged image (right). NBCe1 (white arrowhead) and NKCC1 (open arrows) recruitment to the basolateral membranes of enterocytes is shown; NKCC1 redistribution to the basolateral membranes (open arrowhead) of goblet cells (G) is shown. Scale bars: A and F, 10 μm; BE, 25 μm.
Fig. 11.
Fig. 11.
Densitometry analysis of normalized NHE3, CFTR, NBCe1 and NKCC1 fluorescence intensities (FI) at the apical or lateral membranes, and apical intracellular compartments of enterocytes and goblet cells along the crypt-villus axis in untreated and CCh-treated jejunum. Cells were analyzed from the lower and upper third of crypts, and lower and upper third of villi. *Significant difference from the untreated group. &“Upper” untreated group significantly different from “lower” untreated group. β1 and β2, no significant difference between group β1 and group β2.

Similar articles

Cited by

References

    1. Ainsworth M, Koss MA, Hogan DL, Isenberg JI. Higher proximal duodenal mucosal bicarbonate secretion is independent of Brunner's glands in rats and rabbits. Gastroenterology 109: 1160–1166, 1995 - PubMed
    1. Allen A, Flemstrom G. Gastroduodenal mucus bicarbonate barrier: protection against acid and pepsin. Am J Physiol Cell Physiol 288: C1–C19, 2005 - PubMed
    1. Alper SL, Rossmann H, Wilhelm S, Stuart-Tilley AK, Shmukler BE, Seidler U. Expression of AE2 anion exchanger in mouse intestine. Am J Physiol Gastrointest Liver Physiol 277: G321–G332, 1999 - PubMed
    1. Ameen N, Alexis J, Salas P. Cellular localization of the cystic fibrosis transmembrane conductance regulator in mouse intestinal tract. Histochem Cell Biol 114: 69–75, 2000 - PubMed
    1. Ameen N, Apodaca G. Defective CFTR apical endocytosis and enterocyte brush border in myosin VI-deficient mice. Traffic 8: 998–1006, 2007 - PubMed

Publication types

MeSH terms

Substances