. 2010 Oct 8:4:147.
doi: 10.3389/fnsys.2010.00147. eCollection 2010.

Disrupted modularity and local connectivity of brain functional networks in childhood-onset schizophrenia

Affiliations

Disrupted modularity and local connectivity of brain functional networks in childhood-onset schizophrenia

Aaron F Alexander-Bloch et al. Front Syst Neurosci. .

Abstract

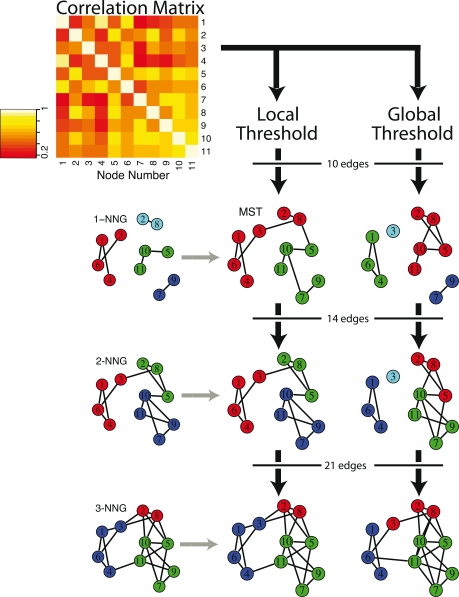
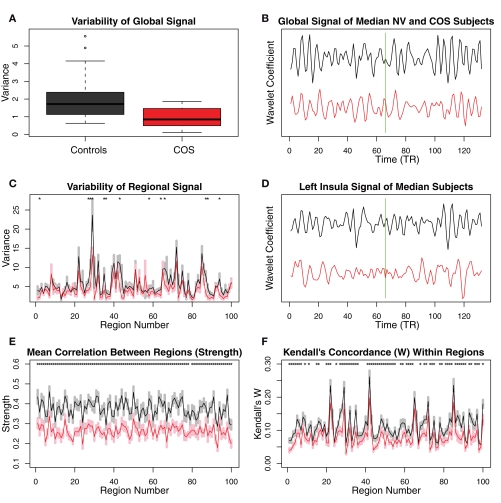
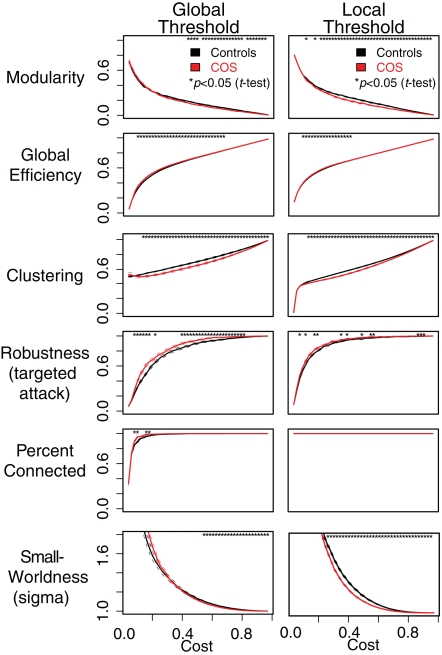
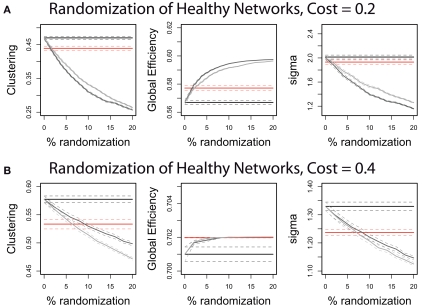
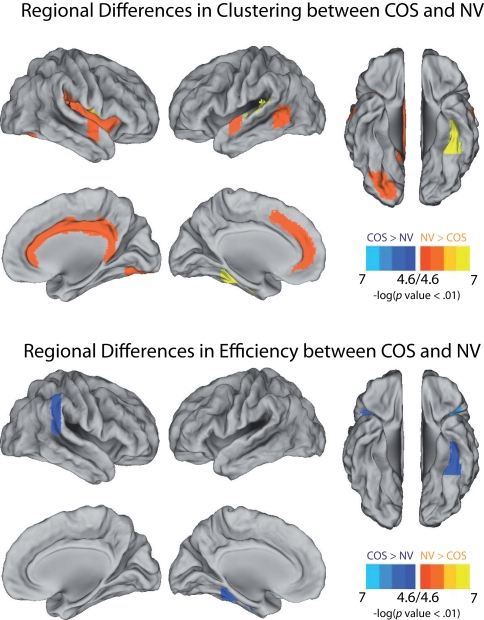
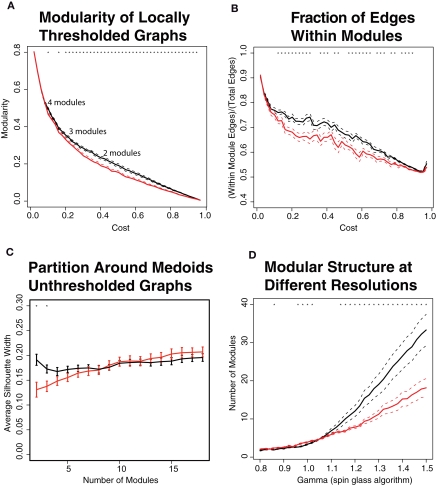
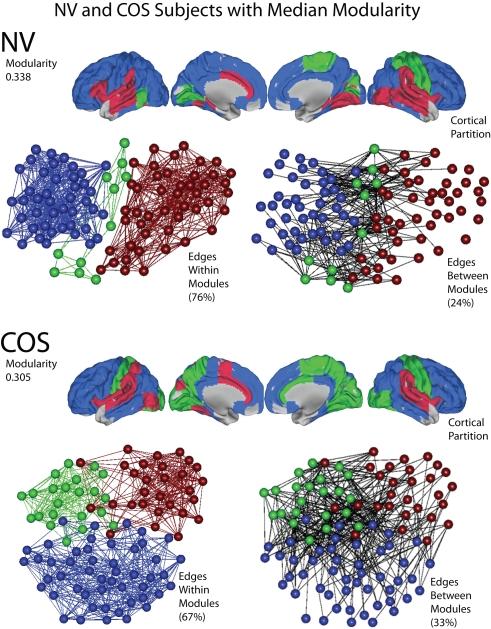
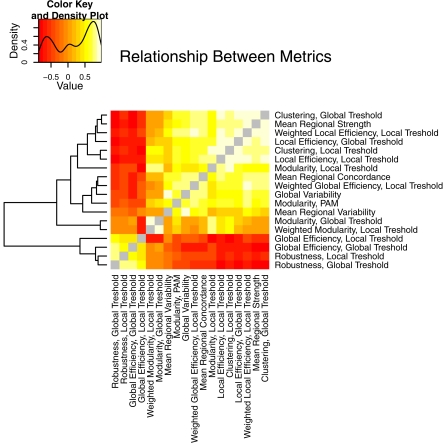
Modularity is a fundamental concept in systems neuroscience, referring to the formation of local cliques or modules of densely intra-connected nodes that are sparsely inter-connected with nodes in other modules. Topological modularity of brain functional networks can quantify theoretically anticipated abnormality of brain network community structure - so-called dysmodularity - in developmental disorders such as childhood-onset schizophrenia (COS). We used graph theory to investigate topology of networks derived from resting-state fMRI data on 13 COS patients and 19 healthy volunteers. We measured functional connectivity between each pair of 100 regional nodes, focusing on wavelet correlation in the frequency interval 0.05-0.1 Hz, then applied global and local thresholding rules to construct graphs from each individual association matrix over the full range of possible connection densities. We show how local thresholding based on the minimum spanning tree facilitates group comparisons of networks by forcing the connectedness of sparse graphs. Threshold-dependent graph theoretical results are compatible with the results of a k-means unsupervised learning algorithm and a multi-resolution (spin glass) approach to modularity, both of which also find community structure but do not require thresholding of the association matrix. In general modularity of brain functional networks was significantly reduced in COS, due to a relatively reduced density of intra-modular connections between neighboring regions. Other network measures of local organization such as clustering were also decreased, while complementary measures of global efficiency and robustness were increased, in the COS group. The group differences in complex network properties were mirrored by differences in simpler statistical properties of the data, such as the variability of the global time series and the internal homogeneity of the time series within anatomical regions of interest.

Keywords: brain; clustering; fMRI; graph theory; modularity; network; schizophrenia.


Figures

Figure 1
Figure 1
Schematic illustrating local and global thresholding methods, and how these methods impact on the modular structure of graphs constructed from a correlation matrix. Starting with a model correlation matrix, which shows the functional connectivity between a subset of 11 brain regions for one subject, the two different thresholding methods are used to construct graphs with increasing numbers of edges. On the left, applying a local threshold produces connected supersets of the k nearest neighbor graph (k-NGG), which includes edges for each node's k highest functional connections, shown here for k = 1, 2, 3. The minimum spanning tree (MST) is a connected superset of the 1-NNG, and connects all 11 nodes with the lowest possible number of edges and the highest possible functional connectivity. On the right, applying a global threshold simply includes edges between the pairs of nodes with the highest functional connectivity in order. Nodes of the same color are in the same module, as determined by the fast greedy algorithm, showing the influence of graph construction and edge density on the modular partition.
Figure 2
Figure 2
Plots showing differences between the schizophrenic patients and the controls in terms of relatively simple, non-graph-theoretical properties of their MRI time series. (A) The variability in the scale 2 (0.05–0.111 Hz) global MR signal is higher in the controls than in the COS population. (B) The difference in the variability of the global MR signal is illustrated with the time series from the median subjects of each population. The green line shows the boundary between the successive scans, whose wavelet coefficients were concatenated. (C) There is a trend toward greater variability in the MR signal of anatomical regions, in the control population relative to the COS population. (D) The difference in the variability of the regional MR signals is illustrated with the time series from the median subjects of each population for one of the regions that shows a difference, the left insula. (E) Regional strength, the average wavelet correlation between each region and every other region, is decreased in the COS population. (F) Kendall's coefficient of concordance (W), a measure of the homogeneity of the signal within each anatomical region, is decreased in the COS population. Error bars are standard mean error, and asterisks signify p < 0.05 uncorrected p-value from a t-test.
Figure 3
Figure 3
Plots showing differences between the schizophrenic patients (red) and the controls (black) in terms of the graph theoretical properties of the brain networks, which have been constructed using local and global thresholding methods. The two methods produce a similar pattern of group differences. However, local thresholding ensures connected graphs and appears to be more sensitive to group differences in some complex network metrics. The six different graph theoretical measures are shown as a function of connection density or topological cost, which is the proportion of edges included. Error bars are standard mean error, and asterisks signify an uncorrected p < 0.05 for a t-test between the COS population and control population.
Figure 4
Figure 4
The quantitative properties of the schizophrenic patients’ brain networks can be approximated by randomizing a small proportion of the edges of the controls’ brain networks. Illustrated on graphs with 0.2 topological cost (A) and on graphs with 0.4 topological cost (B), the control networks have 0–20% of their edges randomized. The straight lines show the mean values of the controls (black) and patients (red) in clustering coefficient, global efficiency and small-worldness (sigma). The gray curves show the effect on these network properties of randomizing the control networks: The light gray curves result if the edges are rewired completely at random, whereas the dark gray curves result if the edges are rewired so as to preserve the degree distribution of the original graphs. See Section "“Materials and Methods” for explanations of the network measures and the randomization procedures.
Figure 5
Figure 5
Illustrations of the anatomical foci of decreased clustering and increased global efficiency in schizophrenic (COS) patients relative to controls (NV). At a local threshold of 0.3 topological cost, permutation tests estimated the significance of the differences in regional clustering and efficiency, which are calculated in the same way as the clustering coefficient and the global efficiency, but for each of the 100 nodes individually. Estimations of significance were based on 2000 permutations per region, with p-values corrected for 100 multiple comparisons using a false positive correction p < 1/N = 0.01 Surface representations were created using Caret (http://brainmap.wustl.edu/caret/).
Figure 6
Figure 6
The modular structure of brain networks is disturbed in the childhood-onset schizophrenia (COS) population (red) relative to the control population (black). (A) Modularity is calculated using the fast greedy algorithm on binary, locally thresholded graphs. The COS networks have lower modularity, especially in the range of topological costs where the networks are partitioned into less than 5 modules. (B) The fraction of intra-modular edges, which link nodes in the same module, is decreased in COS. This value is the same as modularity except not normalized by the expected fraction of intra-modular edges. (C) Using the unsupervised learning algorithm Partition Around Medoids (PAM), when the graphs are partitioned into less than 5 modules, the healthy controls have higher modularity as quantified by the average silhouette width. (D) Using a spin glass model with simulated annealing, which looks at the modular structure at different resolutions depending on the gamma parameter, the controls have a wider range of modular structure at different scales.
Figure 7
Figure 7
An illustration of modularity, using representative brain networks from the childhood-onset schizophrenia (COS) population and the control (NV) population. At a local threshold of 0.22 topological cost, the modular partition is shown for the median NV subject (above) and the median COS subject (below), in terms of modularity estimated by the fast greedy algorithm. Each module is assigned a specific color, and the modular structure of each subject is illustrated in three different ways: the cortical partition shows the anatomical location of the modules; the left-hand topological plot shows the density of intra-modular edges, between nodes in the same module; and the right-hand topological plot shows the density of inter-modular edges, between nodes in different modules. The layouts of the topological plots are determined by a force-directed algorithm (Fruchterman and Reingold, 1991).
Figure 8
Figure 8
An illustration of the relationship between the different properties of brain networks, including both graph theoretical and non-graph-theoretical metrics. The metrics from Table 1 are correlated between all the subjects in the study and presented as a heat map, with the color value corresponding to the Pearson's correlation coefficient. The layout is organized by complete linkage hierarchical clustering, according to the dendrogram shown at the left of the figure.

Similar articles

Cited by

References

    1. Achard S., Bullmore E. (2007). Efficiency and cost of economical brain functional networks. PLoS Comput. Biol. 3, e17.10.1371/journal.pcbi.0030017 - DOI - PMC - PubMed
    1. Achard S., Salvador R., Whitcher B., Suckling J., Bullmore E. (2006). A resilient, low-frequency, small-world human brain functional network with highly connected association cortical hubs. J. Neurosci. 26, 63–7210.1523/JNEUROSCI.3874-05.2006 - DOI - PMC - PubMed
    1. Anderson B., Butts C., Carley K. (1999). The interaction of size and density with graph-level indices. Soc. Networks 21, 239–26710.1016/S0378-8733(99)00011-8 - DOI
    1. Barabasi A., Albert R. (1999). Emergence of scaling in random networks. Science 286, 509–51210.1126/science.286.5439.509 - DOI - PubMed
    1. Bassett D. S., Bullmore E., Verchinski B. A., Mattay V. S., Weinberger D. R., Meyer-Lindenberg A. (2008). Hierarchical organization of human cortical networks in health and schizophrenia. J. Neurosci. 28, 9239–924810.1523/JNEUROSCI.1929-08.2008 - DOI - PMC - PubMed

LinkOut - more resources