. 2010 Oct 12:2:131.
doi: 10.3389/fnene.2010.00131. eCollection 2010.

Microglia in close vicinity of glioma cells: correlation between phenotype and metabolic alterations

Affiliations

Microglia in close vicinity of glioma cells: correlation between phenotype and metabolic alterations

Pierre Voisin et al. Front Neuroenergetics. .

Abstract

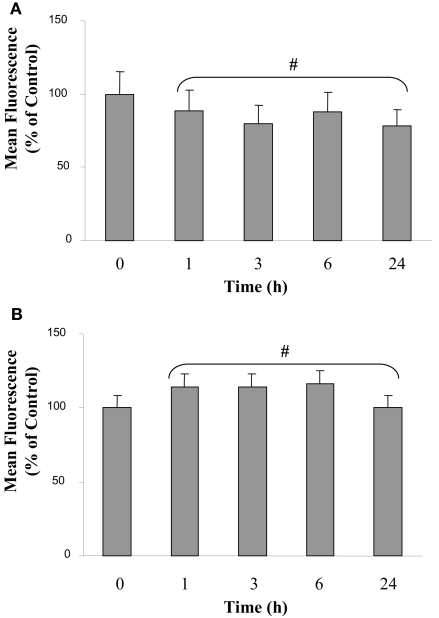
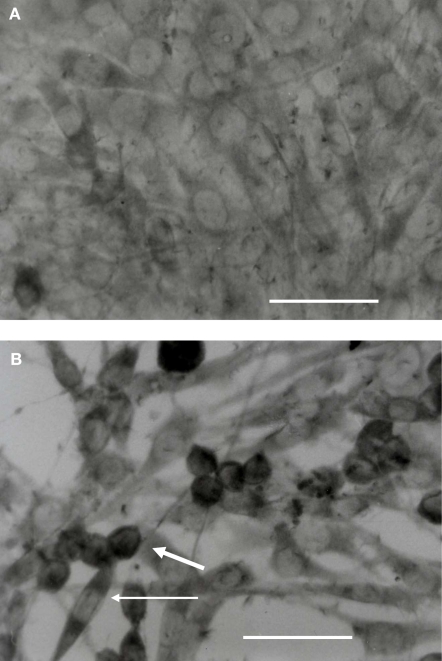
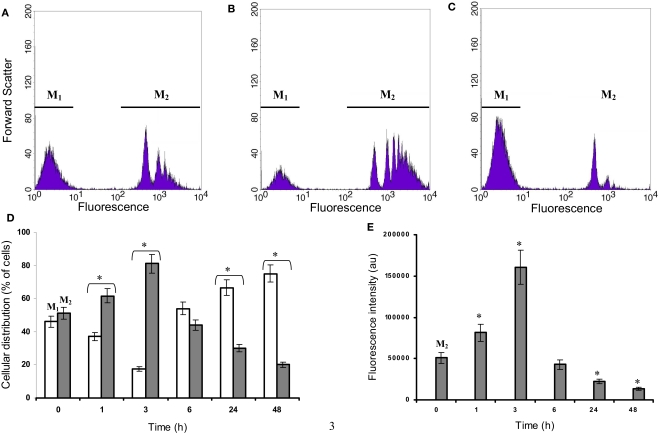
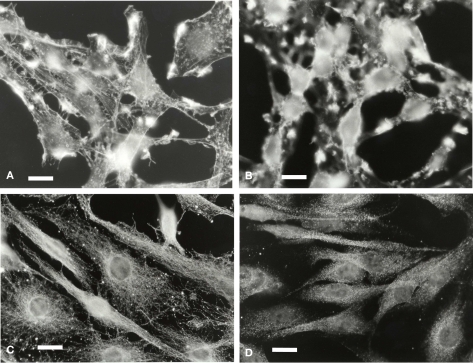
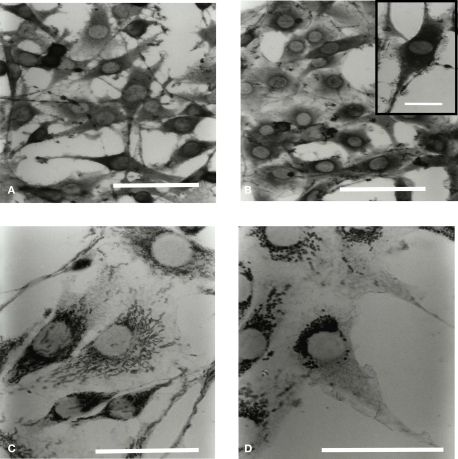
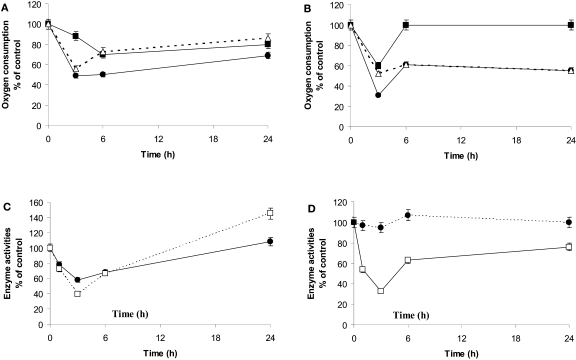
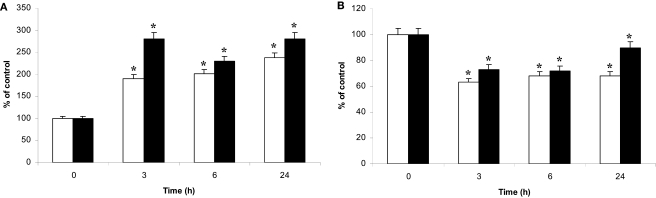
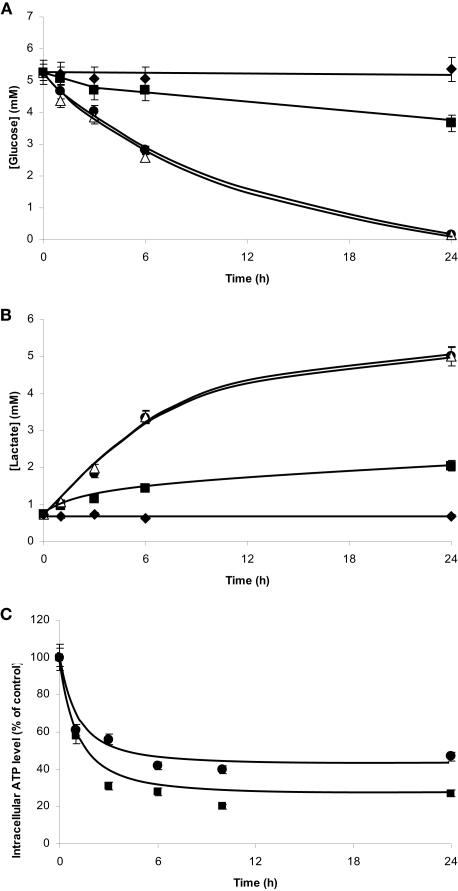
Microglia are immune cells within the central nervous system. In brain-developing tumors, gliomas are able to silence the defense and immune functions of microglia, a phenomenon which strongly contributes to tumor progression and treatment resistance. Being activated and highly motile, microglia infiltrate tumors and secrete macrophagic chemoattractant factors. Thereafter, the tumor cells shut down their immune properties and stimulate the microglia to release tumor growth-promoting factors. The result of such modulation is that a kind of symbiosis occurs between microglia and tumor cells, in favor of tumor growth. However, little is known about microglial phenotype and metabolic modifications in a tumoral environment. Co-cultures were performed using CHME5 microglia cells grown on collagen beads or on coverslips and placed on monolayer of C6 cells, limiting cell/cell contacts. Phagocytic behavior and expression of macrophagic and cytoskeleton markers were monitored. Respiratory properties and energetic metabolism were also studied with regard to the activated phenotype of microglia. In co-cultures, transitory modifications of microglial morphology and metabolism were observed linked to a concomitant transitory increase of phagocytic properties. Therefore, after 1 h of co-culture, microglia were activated but when longer in contact with tumor cells, phagocytic properties appear silenced. Like the behavior of the phenotype, microglial respiration showed a transitory readjustment although the mitochondria maintained their perinuclear relocation. Nevertheless, the energetic metabolism of the microglia was altered, suggesting a new energetic steady state. The results clearly indicate that like the depressed immune properties, the macrophagic and metabolic status of the microglia is quickly driven by the glioma environment, despite short initial phagocytic activation. Such findings question the possible contribution of diffusible tumor factors to the microglial metabolism.

Keywords: C6 cells; NMR spectroscopy; glioma; metabolism; microglia; phenotype.


Figures

Figure 1
Figure 1
Calcein and propidium iodide fluorescence of microglia in co-culture. The calcein (A) and the propidium iodide (B) fluorescence were analyzed by flow cytometry. Results are expressed as percentage of the control mean values of fluorescence of 30,000 labeled microglial cells. The mean values of fluorescence represent 1800 and 12 arbitrary units for the calcein and the propidium iodide fluorescence in isolated microglia, respectively. Results were obtained from three independent experiments. #: No statistical difference between values at each time point and values at t = 0 h (p > 0.95).
Figure 2
Figure 2
Microglia immuno-characterization of the ED1 antigen during co-culture. The microglia were grown on coverslips during 48 h and placed on Petri dishes with or without C6 cell monolayers. (A,B) are representative of the t = 0-h and t = 3-h time points, respectively. Cells were fixed and labeled with an ED1 antibody. Thick white arrow: ovoïd labeled cell; thin white arrow: elongated labeled cell. The scale is 50 μm (A,B).
Figure 3
Figure 3
Microglial fluorescent bead uptake in a C6 cell environment. Microglia were co-cultured with C6 cells for different time points during 24 h and incubated with fluorescent beads of 1 μm diameter as described in experimental procedures. Thereafter, microglia were isolated and the fluorescence was analyzed by flow cytometry. (A–C) were obtained for microglia co-cultured at t = 0, 3 and 24 h, respectively. The gates M1 and M2 were chosen from the t = 0 h co-culture, where two populations with a low (M1) and a high (M2) level of fluorescence were observed. The percentages of the M1 (white) and M2 (gray) selected populations (three independent experiments) were calculated for the time points t = 1, 3, 24, and 48 h (D). Values in (E) were calculated from each gate and each time point as the product of the gated population percent multiplied by the corresponding mean fluorescence of this population (M1 values are very low). *: Values significantly different from its t = 0 h corresponding value (p < 0.01).
Figure 4
Figure 4
Microglial F-actin and tubulin characterization in a C6 cell environment. Microglia were labeled for F-actin at t = 0 h (A), and t = 3 h of co-culture (B) and for tubulin (C,D, 0 and 3 h of co-culture, respectively. The scale is 20 μm in (A,B) and 30 μm in (C,D).
Figure 5
Figure 5
Microglial Hsc70 and Hsp60 immunolabeling in a C6 cell environment. Cells were processed for immuno labeling with antibodies specific for Hsc70 (A,B) and Hsp60 (C,D) proteins. (A,C) and (B,D) correspond to the time points 0 and 3 h of co-culture, respectively. The scale is 30 μm in (A,B) (insert: 10 μm), and 20 μm in (C,D).
Figure 6
Figure 6
Respiratory properties, dehydrogenase and citrate synthase activities. (A,B): Oxygen consumption by microglia (A) or C6 cells (B) was measured by polarogaphy at different times of co-culture. For each time point, respiration is determined in the absence of any effectors (endogenous oxygen consumption: •, black dots) or after subsequent addition of the uncoupler (CCCP) during the oxygen consumption recording (◼, black squares). ᐃ (white triangles) is representative of the oxygen consumption ratio between the endogenous and that in presence of CCCP. Results are expressed as percentage of the mean value point to the control cells (mean ± SD for three independent experiments) for each time point. Microglial control values are 4 nmol/min/106 cells and 9 nmol/min/106 cells for endogenous and uncoupled oxygen consumption, respectively. C6 cell control values are 3.4 nmol/min/106 cells and 6.4 nmol/min/106 cells for the endogenous and uncoupled oxygen consumption, respectively. (C,D): citrate synthase activity (□, white squares) and MTT oxidation rates (•, black dots) of microglia (C) and C6 cells (D) in co-culture. Activities were determined spectrophotometrically for the different periods of co-culture as described in experimental procedures. Results from three independent experiments (mean ± SD) are expressed as percentage of the control cell specific activity of the citrate synthase (33 nmol/min/106 cells and 12 nmol/min/106 cells for the microglia and the C6 cells, respectively) and for the formazan production as a percent of the optical density measured on isolated culture cells.
Figure 7
Figure 7
NAO binding and DIOC6 uptake by the microglia and the C6 cells in co-culture. Microglia on beads were co-cultured on C6 cell monolayers in Petri dishes for t = 0 to t = 24-h time points. Then, cell populations were separated, incubated either with NAO (A) or with the potential probe DIOC6 (B). Thereafter, fluorescence was analyzed by flow cytometry as described in experimental procedures. (A): NAO binding in C6 cells (white bars) and microglia (black bars), respectively. (B): DIOC6 accumulation in C6 cells (white bars) and microglia (black bars), respectively. All the results are from three independent experiments (mean ± SD) and are expressed as percentage of the mean fluorescence either of NAO or of DIOC6 uptake compared to the control values measured from isolated cultures. *: value significantly different from the t = 0 time point (p < 0.01).
Figure 8
Figure 8
Glucose consumption, lactate production and ATP readjustments in co-culture. Microglia and C6 cells were cultured on beads and as monolayer on Petri dishes, respectively. Cultures were performed either in isolated culture conditions for each cell type or mixed in co-culture. Aliquots of the culture media were collected at different time points from t = 0 to t = 24 h for glucose (A) and lactate (B) quantifications. (A): Glucose concentrations in the medium from isolated microglia(◼), isolated C6 cells (•), microglia/C6 cell co-culture (ᐃ), and Petri dishes without cell (♦). (B): Lactate concentrations in the medium from isolated microglia (◼), isolated C6 cells (•), microglia/C6 cell co-culture (ᐃ), and Petri dishes without cell (♦). ATP quantification (C) was performed from perchloric cell extracts by the luciferin–luciferase method. (◼) and (•): ATP contents in microglia and C6 cells, respectively, when in co-culture. Results, from three independent experiments (mean ± SD), are expressed as percentage of the ATP content for the time point compared to the control (3 nmol/106 cells and 1.3 nmol/106 cells for the microglia and the C6 cells, respectively).
Figure 9
Figure 9
Phosphorylated metabolites in co-culture. The phosphorylated metabolite contents were quantified using 31P-NMR spectroscopy analysis of cell extracts performed at different time points of co-culture, as described in experimental procedures. ATP, PCr and Pi contents (A,C), and PC (phosporylcholine) and GPC (glycerophosporylcholine) contents (B,D), concern the microglia (A,B) and the C6 cells (C,D). Results, from three different experiments, are expressed as percentage of metabolite contents from cells grown in isolated conditions. *: significantly different from the control (p < 0.01); #: no statistical difference from value at t = 0. The mean values of the phosphorylated metabolites from the microglia and the C6 cells grown in isolated conditions are summarized Table 2.

Similar articles

Cited by

References

    1. Aloisi F. (2001). Immune function of microglia. Glia 36, 165–179 - PubMed
    1. Asai J., Suzuki R., Fujimoto T., Suzuki T., Nakagawa N., Nagashima G., Miyo T., Hokaku H., Takei A. (1999). Fluorescence automatic cell sorter and immunohistochemical investigation of CD68-positive cells in meningioma. Clin. Neurol. Neurosurg. 101, 229–23410.1016/S0303-8467(99)00052-9 - DOI - PubMed
    1. Bachelet M., Adrie C., Polla B. S. (1998). Macrophages and heat shock proteins. Res. Immunol. 149, 727–73210.1016/S0923-2494(99)80047-9 - DOI - PubMed
    1. Bacurau R. F., Homem De Bittencourt P. I., Jr., Newsholme P., Costa Rosa L. F. (1999). Metabolic response of macrophages to injury promoted by the activated complement system. Cell Biochem. Funct. 17, 175–18210.1002/(SICI)1099-0844(199909)17:3<175::AID-CBF825>3.0.CO;2-S - DOI - PubMed
    1. Badaut J., Brunet J. F., Petit J. M., Guerin C. F., Magistretti P. J., Regli L. (2008). Induction of brain aquaporin 9 (AQP9) in catecholaminergic neurons in diabetic rats. Brain Res. 1188, 17–2410.1016/j.brainres.2007.10.087 - DOI - PubMed

LinkOut - more resources