

Differential expression of peroxiredoxins in prostate cancer: consistent upregulation of PRDX3 and PRDX4
- PMID: 21031435
- PMCID: PMC3107902
- DOI: 10.1002/pros.21292
Differential expression of peroxiredoxins in prostate cancer: consistent upregulation of PRDX3 and PRDX4
Abstract
Background: The peroxiredoxins (PRDXs) are emerging as regulators of antioxidant defense, apoptosis, and therapy resistance in cancer. Because their significance in prostate cancer (PCa) is unclear, we investigated their expression and clinical associations in PCa.
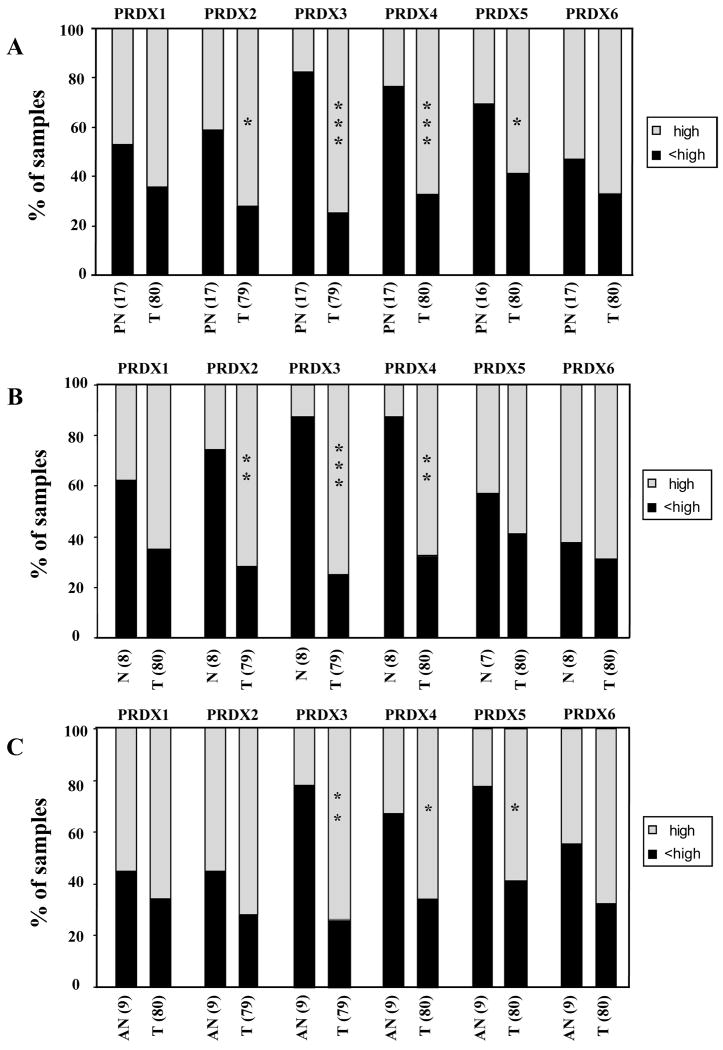
Methods: Transcript expression of PRDX1-6 in PCa was evaluated in cancer gene microarray datasets, whereas protein expression was evaluated by immunoblotting in prostate cell lines, and by immunohistochemistry (IHC) in prostate tissue microarrays (TMAs) containing tumor (n = 80) and control (n = 17) tissues. PRDX3 was also analyzed in TMAs containing PCa tissues from African-American and Caucasian patients (n = 150 per group). PRDX expression was correlated with patients' clinicopathologic characteristics.
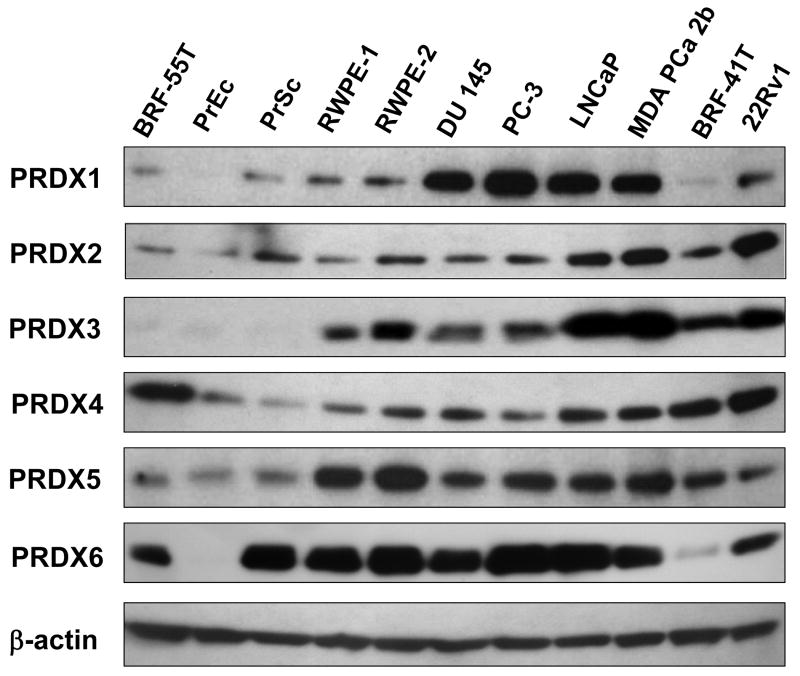
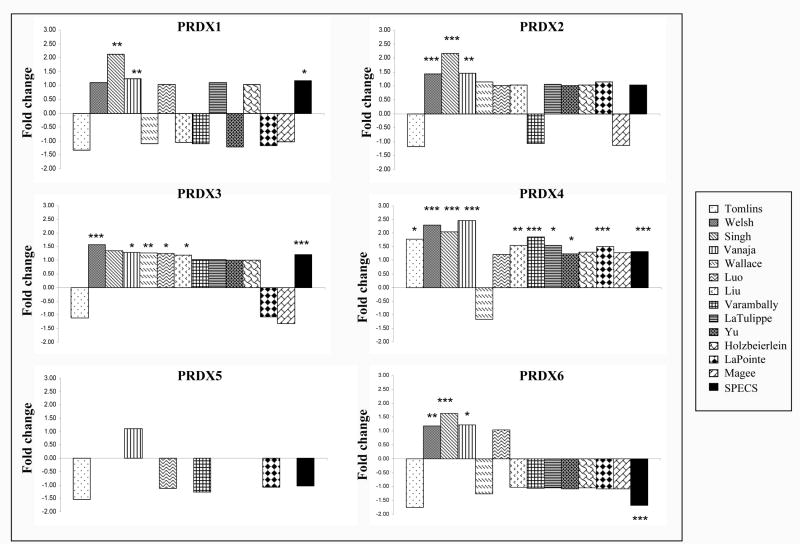
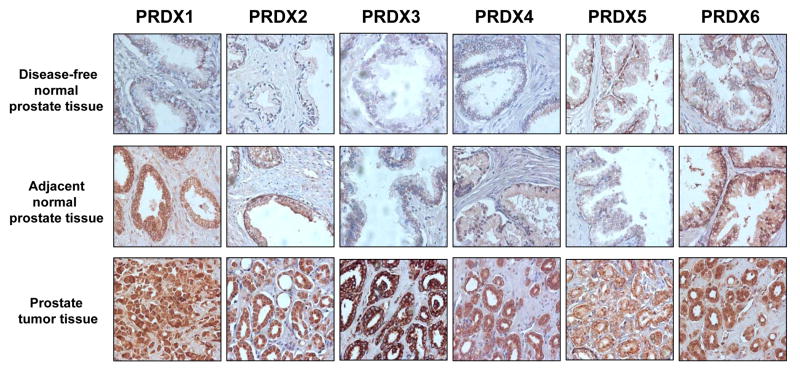
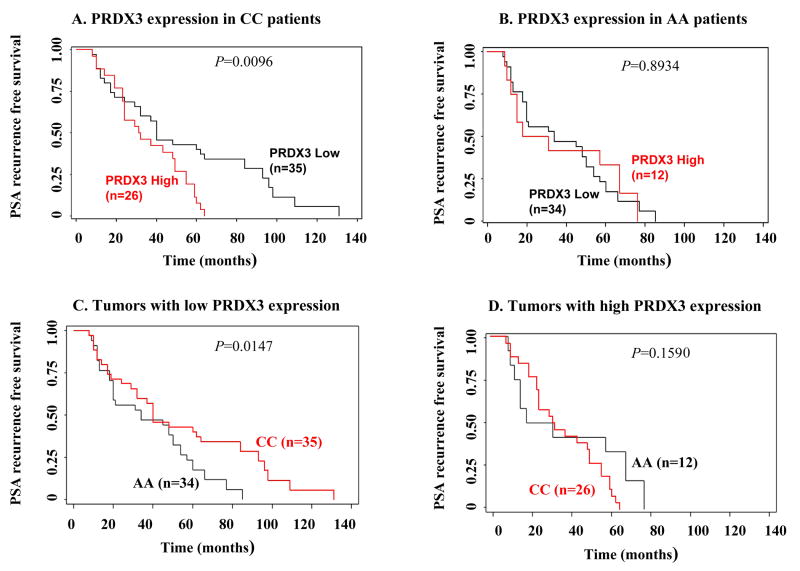
Results: Analysis of PRDX expression in cancer microarray datasets revealed consistent upregulation (tumor vs. normal) of PRDX3 and 4. All PRDXs exhibited elevated protein expression in PCa cell lines, compared with non-tumor cells. IHC revealed significant overexpression of PRDX3 and 4 in PCa, associated with age, increased prostate specific antigen (PSA), tumor stage, or Gleason score. High PRDX3 staining was associated with early age and elevated Gleason score at time of radical prostatectomy in African-American but not in Caucasian patients with PCa. PSA recurrence free survival in patients with low PRDX3 tumor expression was significantly longer in Caucasians compared to African-Americans, but no difference was detected for high expression.
Conclusions: PRDXs exhibit differential expression in prostate tumors, with PRDX3 and 4 consistently upregulated. Their role in PCa development, and their potential as biological determinants of PCa health disparities and novel therapeutic targets, deserve further investigation.
Copyright © 2010 Wiley-Liss, Inc.
Figures
References
-
- Jemal A, Siegel R, Ward E, Hao Y, Xu J, Thun MJ. Cancer Statistics, 2009. CA Cancer J Clin. 2009;59(4):225–249. - PubMed
-
- Jones BA, Liu WL, Araujo AB, Kasl SV, Silvera SN, Soler-Vila H, Curnen MG, Dubrow R. Explaining the race difference in prostate cancer stage at diagnosis. Cancer Epidemiol Biomarkers Prev. 2008;17(10):2825–2834. - PubMed
-
- Karami S, Young HA, Henson DE. Earlier age at diagnosis: another dimension in cancer disparity? Cancer Detect Prev. 2007;31(1):29–34. - PubMed
-
- Hoffman RM, Gilliland FD, Eley JW, Harlan LC, Stephenson RA, Stanford JL, Albertson PC, Hamilton AS, Hunt WC, Potosky AL. Racial and ethnic differences in advanced-stage prostate cancer: the Prostate Cancer Outcomes Study. J Natl Cancer Inst. 2001;93(5):388–395. - PubMed
Publication types
MeSH terms
Substances
Grants and funding
LinkOut - more resources
Full Text Sources
Medical
Research Materials
Miscellaneous
