Review
. 2010 Nov;32(5):1024-37.
doi: 10.1002/jmri.22338.

Real-time diffusion-perfusion mismatch analysis in acute stroke

Affiliations
Review

Real-time diffusion-perfusion mismatch analysis in acute stroke

Matus Straka et al. J Magn Reson Imaging. 2010 Nov.

Abstract

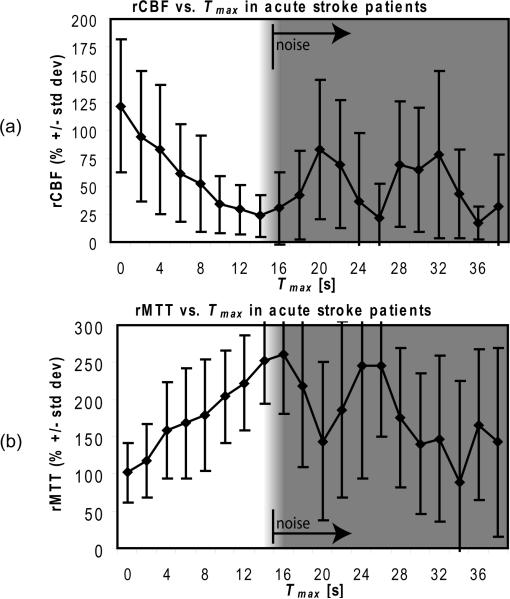
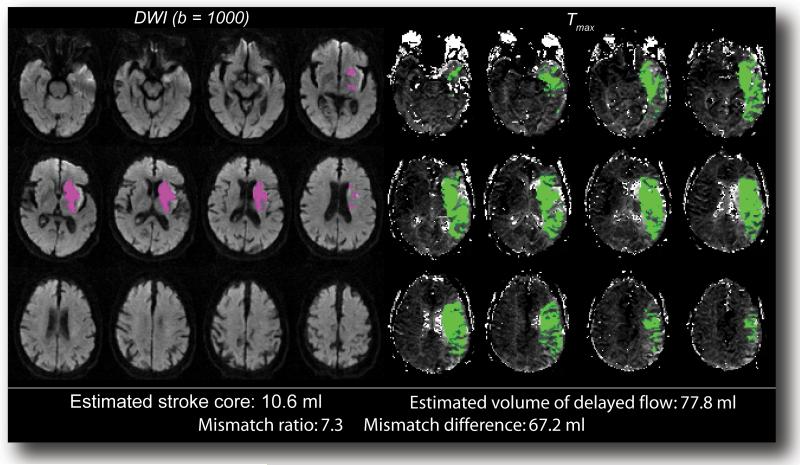
Diffusion-perfusion mismatch can be used to identify acute stroke patients that could benefit from reperfusion therapies. Early assessment of the mismatch facilitates necessary diagnosis and treatment decisions in acute stroke. We developed the RApid processing of PerfusIon and Diffusion (RAPID) for unsupervised, fully automated processing of perfusion and diffusion data for the purpose of expedited routine clinical assessment. The RAPID system computes quantitative perfusion maps (cerebral blood volume, CBV; cerebral blood flow, CBF; mean transit time, MTT; and the time until the residue function reaches its peak, T(max)) using deconvolution of tissue and arterial signals. Diffusion-weighted imaging/perfusion-weighted imaging (DWI/PWI) mismatch is automatically determined using infarct core segmentation of ADC maps and perfusion deficits segmented from T(max) maps. The performance of RAPID was evaluated on 63 acute stroke cases, in which diffusion and perfusion lesion volumes were outlined by both a human reader and the RAPID system. The correlation of outlined lesion volumes obtained from both methods was r(2) = 0.99 for DWI and r(2) = 0.96 for PWI. For mismatch identification, RAPID showed 100% sensitivity and 91% specificity. The mismatch information is made available on the hospital's PACS within 5-7 min. Results indicate that the automated system is sufficiently accurate and fast enough to be used for routine care as well as in clinical trials.


Figures

Figure 1
Figure 1. Basic scheme of the RAPID system workflow
After the diffusion and perfusion data are acquired, the scanner operator pushes the images over the network to a DICOM-compatible RAPID node. There, automatic processing is spawned and the resulting mismatch assessment and computation of PWI parameter maps are performed. Results are then available to hospital PACS, scanner console, email and smartphones in approximately 5-7 minutes.
Figure 2
Figure 2. Details of the RAPID pipeline used to calculate mismatch from DWI and PWI
The PWI processing component consists of motion-correction and adjustments for different acquisition times in multi-slice EPI scans, conversion of measured MR signal to estimated changes of transverse relaxivity, automatic detection of AIF and VOF, correction for nonlinear effect of gadolinium tracer in bulk blood and capillaries, deconvolution, and final computation of perfusion parameters. After the PWI processing, DWI Sb=0 and Sb=1000 images are spatially coregistered with the PWI data and later resliced to the PWI reference frame. The acute stroke core is identified on ADC maps based on an absolute ADC threshold. Critical hypoperfusion is identified based on Tmax prolongation beyond a pre-specified threshold. Finally, DWI and PWI lesion volumes are determined. The mismatch ratio, as well as the difference in PWI and DWI lesion volumes (estimated penumbra) are computed and included in the output summary.
Figure 3
Figure 3. Relation between Tmax, relative CBF (a) and relative MTT (b) in acute stroke
The plots suggest that prolonged delay of blood delivery correlates with reduced perfusion in acute stroke. Regions with mild delays in Tmax (≤ 6 seconds) are typically related to delayed flow in deep white matter and watershed regions, or represent regions with benign oligemia, however, delays of 6-14 seconds are typically related to significant reduction in perfusion. Of note here is that the rCBF and rMTT parameters were obtained by circular, i.e. delay-independent deconvolution. The plots were obtained by analyzing 63 baseline acute stroke cases from DEFUSE trial (1) and averaging results across these datasets. Regions with Tmax < 4 s were used to determine mean value of normal (i.e. 100%) relative CBF and normal relative MTT. Regions with Tmax around 0 s mostly represent arteries, hence the relative CBF is above 100%. Regions with Tmax around 2 s represent proximally fed tissue, whereas regions with Tmax around 4 s is tissue fed distally or watershed regions. Note that to exemplify the relationship between rCBF, rMTT and Tmax in acute stroke, absolute values defining 100% rCBF and rMTT are not important. There is little to no tracer arriving in regions with severely reduced perfusion and thus it is difficult to measure any of the PWI parameters accurately (CBF, MTT, Tmax). As a result, in regions with apparent Tmax > 14 s (shaded parts of the plots) the determined CBF and MTT are mostly a noise-induced random values.
Figure 4
Figure 4. Arterial input (AIF) and venous output (VOF) functions in DSC-MRI
Ideally, the AIF represents the shape of tracer bolus entering the brain. However, the AIF might be scaled due to partial volume effect (PVE). This introduces an unknown confounding factor leading to overestimation of CBV and CBF values. The area under the VOF curve can used to correct for this PVE using Eq. 14. Note that the peak level of VOF tracer concentration is ‘clipped’ (44) at around 8 mM (usual for acquisition at 1.5T with TE = 40ms).
Figure 5
Figure 5. Example of spatially coregistered DWI and PWI datasets
From left to right: Sb=1000 (‘isotropic’ diffusion), Sb=0 (diffusion-weighting gradients turned off = T2-weighted data), apparent diffusion coefficient (ADC), cerebral blood volume (CBV), cerebral blood flow (CBF), mean transit time (MTT) and Tmax. The Sb=1000 and ADC images are used to identify the stroke core, while abnormalities on Tmax and MTT maps indicate hypoperfused tissue. The CBF maps reflect hypoperfusion as well (bottom row), but differences between CBF in gray and white matter and the smaller dynamic range render these maps less conspicuous than maps of temporal perfusion parameters.
Figure 6
Figure 6. Accuracy of stroke core identification on baseline ADC versus ADC threshold for the RAPID algorithm
Identification of stroke core lesions in RAPID requires: 1) thresholding of the ADC values and 2) removal of remaining speckle noise by means of morphological opening operation. This plot depicts the accuracy of stroke core lesion identification after thresholding and morphologic opening as evaluated by ROC analysis. Specifically, the value on vertical axis is the departure of the ROC curve from line of no discrimination (i.e., random guess) for a given ADC threshold. The wide plateau between 560 and 640×10-6 mm2/s is beneficial, as it ensures robustness and accuracy of lesion segmentation even if there are slight changes in imaging parameters such as applied b-value or intersubject variation of normal ADC.
Figure 7
Figure 7. Automatic assessment of DWI/PWI mismatch with RAPID in an acute stroke patient
(Left side) Sb=1000 images overlaid with stroke core identified using ADC threshold. (Right side) Tmax maps with green overlay for regions with abnormal flow (Tmax > 6 s). (Bottom) DWI lesion volume, PWI lesion volume, their ratio and absolute difference is presented. This entire panel is presented automatically to the clinical readers via PACS, scanner console, email and smartphones to facilitate mismatch-based patient triage.
Figure 8
Figure 8. RAPID processing-time benchmark
The majority of the processing time in RAPID is currently spent performing motion correction, DWI/PWI coregistration, DICOM data transfer, and image annotation. The PWI processing algorithms, due to parallelized implementation are not a bottleneck. Total processing time is typically 5-7 minutes, depending on number of slices, imaging matrix, and severity of patient motion.
Figure 9
Figure 9. Comparison of stroke core and hypoperfused region volumes identified by a human reader and by RAPID
Correlation between manual and automated methods for determining stroke core volume on ADC maps (a) and volumes of hypoperfused tissue on Tmax (b). Difference between the methods with respect to mean of the results (Bland-Altman plots), for stroke core on ADC maps (c) and hypoperfused tissue on Tmax (d).

References

    1. Albers GW, Thijs VN, Wechsler L, et al. Magnetic resonance imaging profiles predict clinical response to early reperfusion: the diffusion and perfusion imaging evaluation for understanding stroke evolution (DEFUSE) study. Ann Neurol. 2006;60:508–517. - PubMed
    1. Davis SM, Donnan GA, Parsons MW, et al. Effects of alteplase beyond 3 h after stroke in the echoplanar imaging thrombolytic evaluation trial (EPITHET): a placebo-controlled randomised trial. Lancet Neurol. 2008;7:299–309. - PubMed
    1. Østergaard L, Weisskoff RM, Chesler DA, Gyldensted C, Rosen BR. High resolution measurement of cerebral blood flow using intravascular tracer bolus passages. Part I: Mathematical approach and statistical analysis. Magn Reson Med. 1996;36:715–725. - PubMed
    1. Mouridsen K, Christensen S, Gyldensted L, Ostergaard L. Automatic selection of arterial input function using cluster analysis. Magn Reson Med. 2006;55:524–531. - PubMed
    1. Kosior JC, Frayne R. PerfTool: a software platform for investigating bolus-tracking perfusion imaging quantification strategies. J Magn Reson Imag. 2007;25:653–659. - PubMed

Publication types