. 2010 Dec 15;518(24):4963-79.
doi: 10.1002/cne.22502.

Role of interstitial branching in the development of visual corticocortical connections: a time-lapse and fixed-tissue analysis

Affiliations

Role of interstitial branching in the development of visual corticocortical connections: a time-lapse and fixed-tissue analysis

Edward S Ruthazer et al. J Comp Neurol. .

Abstract

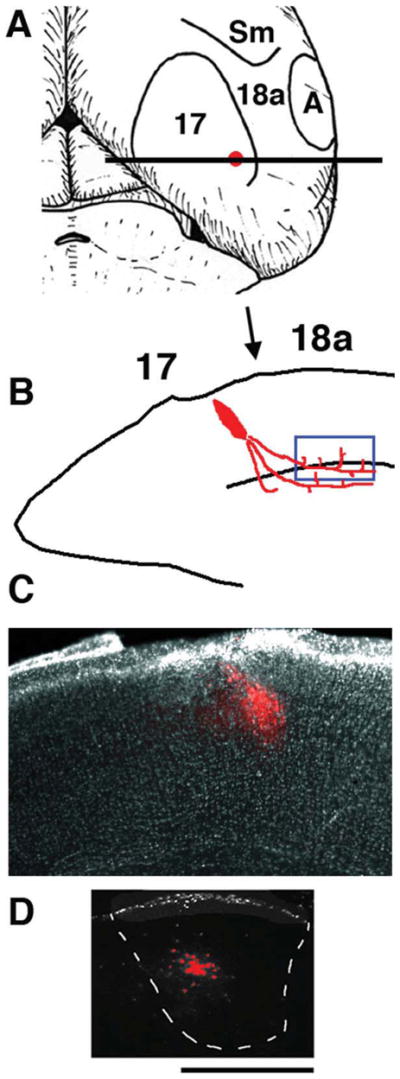
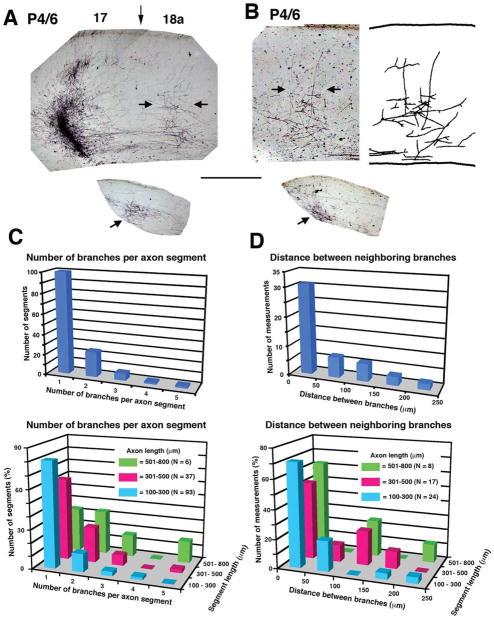
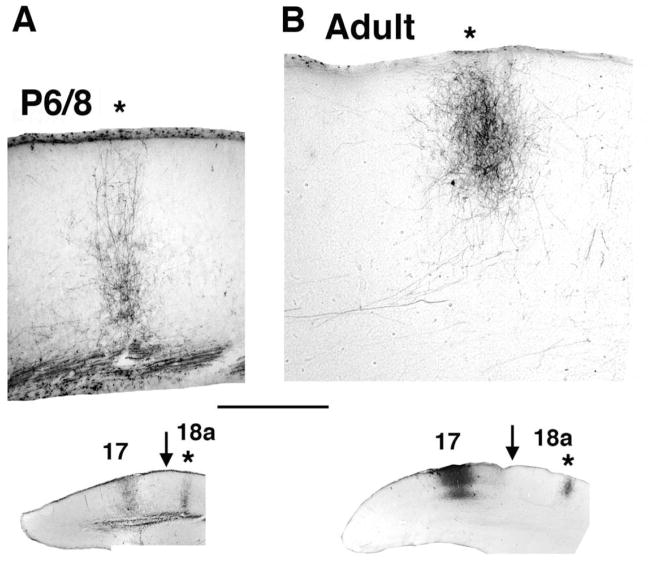
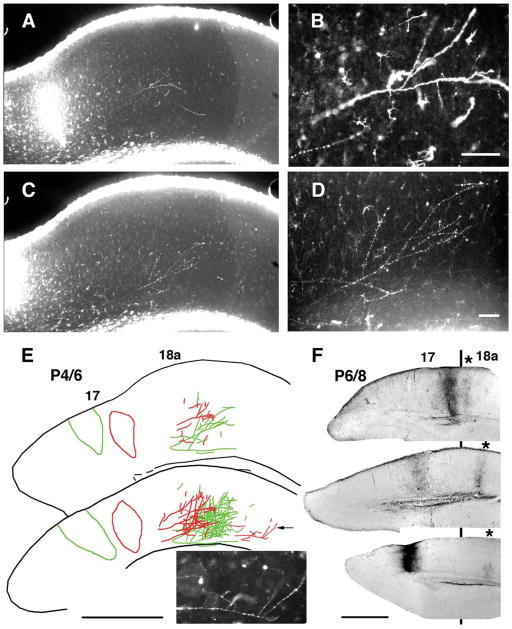
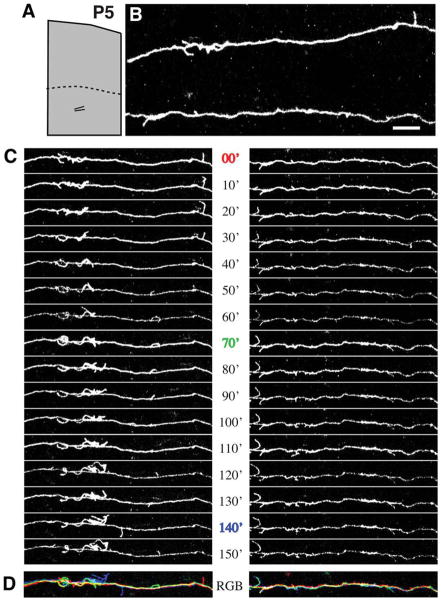
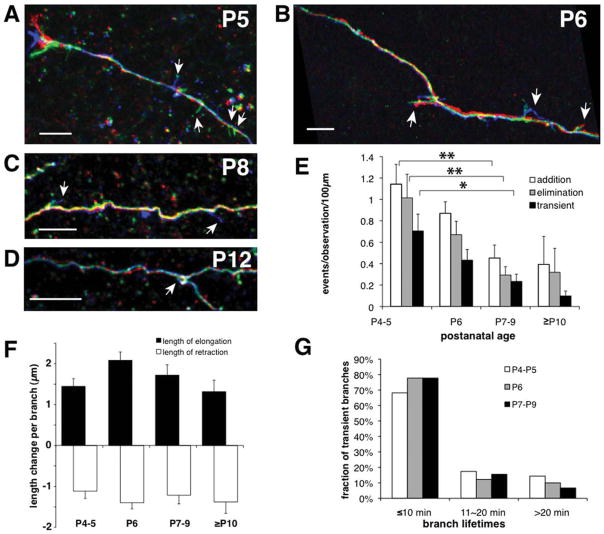
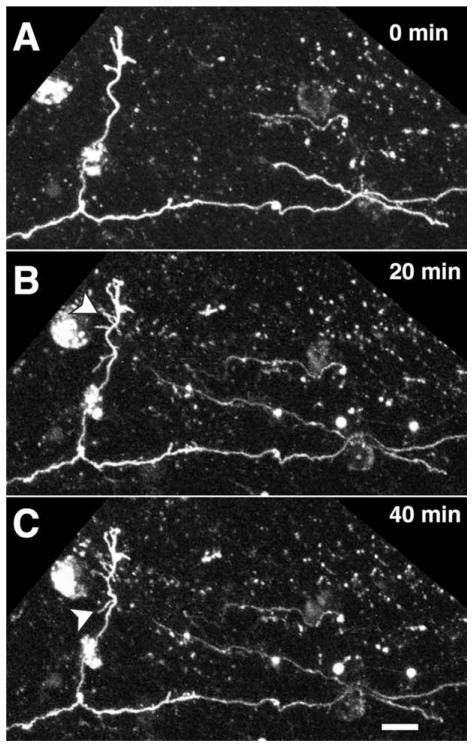
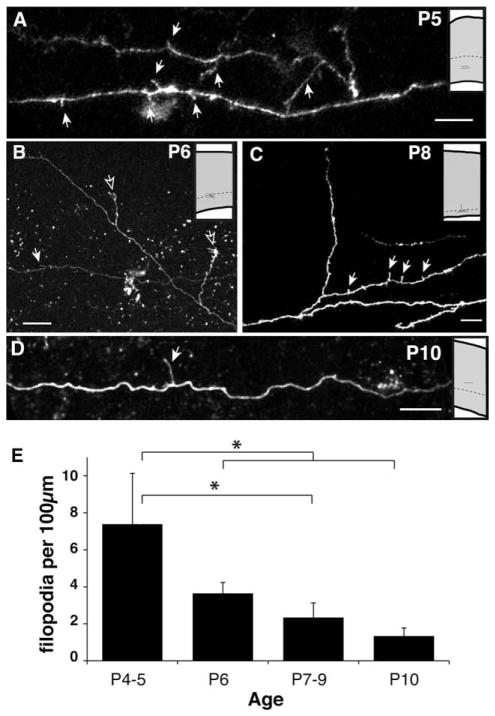
We combined fixed-tissue and time-lapse analyses to investigate the axonal branching phenomena underlying the development of topographically organized ipsilateral projections from area 17 to area 18a in the rat. These complementary approaches allowed us to relate static, large-scale information provided by traditional fixed-tissue analysis to highly dynamic, local, small-scale branching phenomena observed with two-photon time-lapse microscopy in acute slices of visual cortex. Our fixed-tissue data revealed that labeled area 17 fibers invaded area 18a gray matter at topographically restricted sites, reaching superficial layers in significant numbers by postnatal day 6 (P6). Moreover, most parental axons gave rise to only one or occasionally a small number of closely spaced interstitial branches beneath 18a. Our time-lapse data showed that many filopodium-like branches emerged along parental axons in white matter or deep layers in area 18a. Most of these filopodial branches were transient, often disappearing after several minutes to hours of exploratory extension and retraction. These dynamic behaviors decreased significantly from P4, when the projection is first forming, through the second postnatal week, suggesting that the expression of, or sensitivity to, cortical cues promoting new branch addition in the white matter is developmentally down-regulated coincident with gray matter innervation. Together, these data demonstrate that the development of topographically organized corticocortical projections in rats involves extensive exploratory branching along parental axons and invasion of cortex by only a small number of interstitial branches, rather than the widespread innervation of superficial cortical layers by an initially exuberant population of branches.


Figures

Figure 1
Figure 1
Tracer injections into area 17 to reveal anterogradely labeled axons projecting from area 17 to ipsilateral area 18a. Medial is to the left. A: Diagram of top view of right hemisphere showing areas 17 and 18a and approximate location of the intra-cortical injection of anterogradely transported fluorescent tracers dextran Alexa into area 17. B: Diagram of coronal tissue section taken at the level of the horizontal bar in A illustrating the tracer injection in area 17 and the location of the labeled fibers in area 18a analyzed with time-lapse methods (blue box near white matter). Arrow indicates presumptive 17/18a border. C: Low-power image of coronal tissue section showing an injection of Alexa 594 into area 17. D: Image from a coronal section showing the anterogradely labeled field observed in the ipsilateral dLGN following the Alexa 594 injection shown in C. Scale bar = 500 μm.
Figure 2
Figure 2
Area 17–18a projections at P6. A, B: Images from coronal tissue sections from two animals illustrating the area 17–18a projections labeled following discrete intracortical injections of the anterogradely transported tracer BDA into area 17. Medial is to the left. Both animals (case L47 BN in A and case L47 FN in B) were injected with BDA at P4 and studied at P6 (P4/6). Darkly stained field to the left in A corresponds to the tracer injection, and the vertical arrow indicates approximate location of 17/18a border. The injection site is not shown in B. Labeled fibers in area 18a accumulate in column-like fields in regions indicated by the horizontal arrows. The drawing to the right in B is a reconstruction of the labeled field from two neighboring sections. Lower insets show restricted BDA-labeled fields (indicated by arrows) in the dLGN ipsilateral to the injection sites. C: Top histogram illustrates the distribution of parental axon segments with one or more collateral branches independent of the length of the parental axon segment analyzed. Bottom histogram illustrates the distribution of parental axon segments with one or more collateral branches as a function of the length (coded by different colors) of the parental axon segment analyzed. D: Top histogram illustrates the distribution of distances between neighboring branches observed in parental axon segments with more than one branch, independent of the length of the axon segment analyzed. Bottom histogram illustrates the distribution of distances between neighboring branches in parental axon segments with more than one branch as a function of the length (coded by different colors) of the axon segment analyzed. Scale bar = 500 μm.
Figure 3
Figure 3
Area 17–18a projections at P8 and adulthood. A, B: Images from coronal tissue sections illustrating the area 17–18a projections labeled following discrete intracortical injections of the anterogradely transported tracer BDA into area 17. Medial is to the left. A: Column-like field of BDA-labeled fibers in area 18a in an animal (case L24A) injected with BDA into area 17 at P6 and studied at P8. B: Column-like field of BDA-labeled fibers in area 18a in an adult animal (case SI4). Locations of the injection sites in area 17 and the labeled fields in area 18a (asterisks) are shown in the lower insets. Arrows in insets indicate approximate location of 17/18a border. Scale bar = 500 μm.
Figure 4
Figure 4
Topography of striate-extrastriate projection in young rats analyzed in coronal tissue sections. Medial is to the left. A–E: Topography revealed at P6 following paired injections of two different dextran Alexa fluorescent tracers into area 17 at P4. Injections were separated by 350 μm in the mediolateral direction. A, C: Low-power images illustrate tracer injection and the resulting projections in area 18a observed in the same tissue section with AlexaFluor 594 (A) and AlexaFluor 488 (C). Magnified views of fibers in area 18a labeled with each tracer are shown in B and D, respectively. A drawing of data from both tracers observed in this single section is shown in the upper panel in E, and a reconstruction of the data in this section and in two additional neighboring sections is shown in the bottom panel in E. Inset shows magnified view of parental axon (indicated by arrow in drawing) giving rise to several, closely spaced interstitial branches located in a more lateral field, probably area LL (Montero et al., 1973; Olavarria et al., 1984). F: Topography of striate-extrastriate projection in animals injected with BDA at P6 and studied at P8. Coronal sections from three animals show injection of BDA into area 17 and resulting labeled field in area 18a (marked with asterisk). Black line indicates approximate location of 17/18a border. The projections illustrated are probably to presumptive extrastriate area LM (Olavarria and Montero, 1981). Data show mirror-image topography of 17 to 18a projections: as the injection site is displaced medially in area 17, the projection field in area 18a is displaced laterally (Olavarria and Montero, 1981). Scale bars = 100 μm in B, D; 1.00 mm in E, F.
Figure 5
Figure 5
Axons in the subcortical white matter extend numerous, dynamic interstital filopodia. A: At P5, the boundary between gray matter and white matter (dotted line) is roughly 700 μm below the pial surface. B: Segments from a pair of axons running roughly parallel to the pial surface beneath area 18a were imaged by two-photon time-lapse microscopy in a living cortical slice made from P5 rat brain. The location of the pair of imaged axons is schematized in the low-magnification reconstruction in A. C: Images collected at 10-minute intervals reveal highly motile interstitial filopodia. D: Temporal overlay of three time points from series in C. Images from each time point (0, 70, and 140 min) are different colors, and white represents stable regions of the axon. Scale bar = 10 μm.
Figure 6
Figure 6
Frequency of dynamic behaviors, but not growth rates or branch lifetimes, declines with age. A–D: Colorized temporal overlays show dynamic behaviors of interstitial filopodia at P5 (A), P6 (B), P8 (C), and P12 (D). Red, green, and blue correspond to early, middle, and late time points. Arrows indicate dynamic filopodia. E: Rates of branch addition and elimination as well as transient branches all decrease with age (N = 18 axons at P4–5, 30 axons at P6, 23 axons at P7–9, 5 axons at P10–12; *P < 0.05, **P < 0.01 ANOVA with Bonferroni posttest). F: Mean change in length of each dynamic filopodium per imaging interval (usually 10 minutes) was the same at all ages (elongating: N = 336, 268, 208, and 12; retracting: N = 324, 296, 228, and 12, respectively, for P4–5, P6, P7–9, and P10–12). G: Distribution of lifetimes of transient interstitial filopodia was the same at all ages, with the majority of transient branches present only during one image (N = 143, 91, and 41 at P4–5, P6, and P7–9). There were too few transient filopodia (N = 3) in the P10–12 group to generate a meaningful plot. Scale bars = 10 μm.
Figure 7
Figure 7
Pial-directed interstitial branch formed in the white matter along a parental axon from area 17 in a P6 rat pup. A–C: Series of images showing morphological rearrangements (arrowheads) at 20-minute intervals reveals a high degree of filopodial exploration near the tip of the single large interstitial branch that has invaded cortical gray matter. Relatively little filopodial activity is observed along the parental axon at the same times. Scale bar = 10 μm.
Figure 8
Figure 8
Axonal filopodia in the white matter become less prevalent with age. A–D: Examples of white matter or deep layer 6 axons imaged in acute living slices at different ages. Insets show relative locations where images were collected. The presumptive white matter boundary is indicated by a dashed line. This border is found, respectively, at 700 μm, 800 μm, 900 μm, and 1,000 μm in P5, P6, P8, and P10 rat visual cortex (Kageyama and Robertson, 1993). Solid arrows highlight filopodia; open arrows indicate branches entering the cortical gray matter. E: Density of filopodia observed decreases with age. *P < 0.05 ANOVA with Bonferroni posttest. Scale bars = 10 μm.

Similar articles

Cited by

References

    1. Aggoun-Zouaoui D, Innocenti GM. Juvenile visual callosal axons in kittens display origin- and fate-related morphology and distribution of arbors. Eur J Neurosci. 1994;6:1846–1863. - PubMed
    1. Barone P, Dehay C, Berland M, Kennedy H. Role of directed growth and target selection in the formation of cortical pathways: prenatal development of the projection of area V2 to area V4 in the monkey. J Comp Neurol. 1996;374:1–20. - PubMed
    1. Bastmeyer M, O’Leary DDM. Dynamics of target recognition by interstitial axon branching along developing cortical axons. J Neurosci. 1996;16:1450–1459. - PMC - PubMed
    1. Bradke F, Dotti CG. Differentiated neurons retain the capacity to generate axons from dendrites. Curr Biol. 2000;10:1467–1470. - PubMed
    1. Campbell DS, Regan AG, Lopez JS, Tannahill D, Harris WA, Holt CE. Semaphorin 3A elicits stage-dependent collapse, turning, and branching in Xenopus retinal growth cones. J Neurosci. 2001;21:8538–8547. - PMC - PubMed

Publication types

Substances