

Graphical models for inferring single molecule dynamics
- PMID: 21034427
- PMCID: PMC2966289
- DOI: 10.1186/1471-2105-11-S8-S2
Graphical models for inferring single molecule dynamics
Abstract
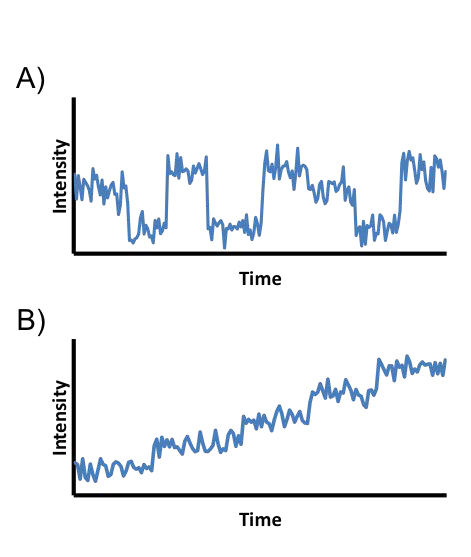
Background: The recent explosion of experimental techniques in single molecule biophysics has generated a variety of novel time series data requiring equally novel computational tools for analysis and inference. This article describes in general terms how graphical modeling may be used to learn from biophysical time series data using the variational Bayesian expectation maximization algorithm (VBEM). The discussion is illustrated by the example of single-molecule fluorescence resonance energy transfer (smFRET) versus time data, where the smFRET time series is modeled as a hidden Markov model (HMM) with Gaussian observables. A detailed description of smFRET is provided as well.
Results: The VBEM algorithm returns the model's evidence and an approximating posterior parameter distribution given the data. The former provides a metric for model selection via maximum evidence (ME), and the latter a description of the model's parameters learned from the data. ME/VBEM provide several advantages over the more commonly used approach of maximum likelihood (ML) optimized by the expectation maximization (EM) algorithm, the most important being a natural form of model selection and a well-posed (non-divergent) optimization problem.
Conclusions: The results demonstrate the utility of graphical modeling for inference of dynamic processes in single molecule biophysics.
Figures
 ,
,  , and
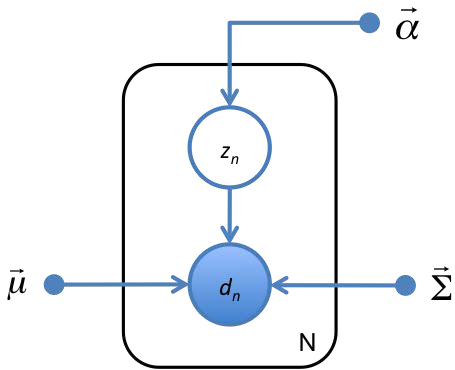
, and  , respectively. Observed variables are represented by open circles, hidden variables are represented by filled circles, and fixed parameters are represented by dots. To avoid drawing nodes for all N hidden and observed variables, the variables are shown once and placed inside a plate which denotes the number or repetitions in the lower right corner. This GM specifies the conditional factorization of
  shown in Eq. 1.
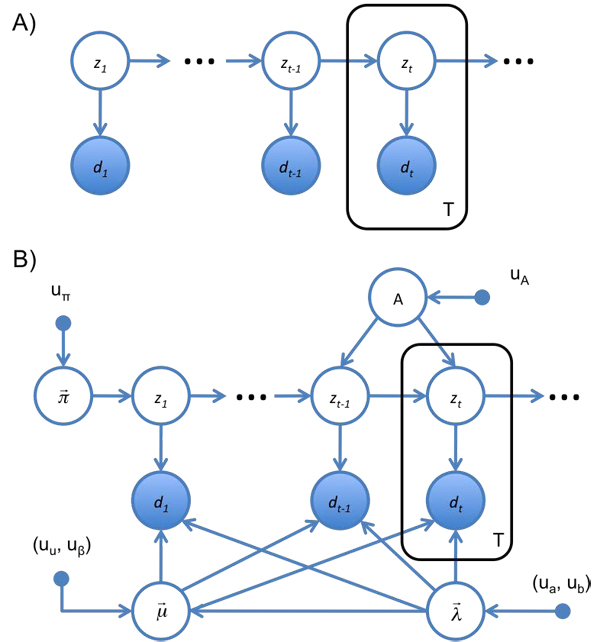
 and precision
  . Transition rates are multinomial, with probabilities given by A. The probability of initially occupying each hidden state is multinomial as well, with probabilities given by
  . Equations for these distributions are described in the text below Eq. 5. This GM specifies the conditional factorization of
  shown in Eq. 6.
Similar articles
-
Learning rates and states from biophysical time series: a Bayesian approach to model selection and single-molecule FRET data.Biophys J. 2009 Dec 16;97(12):3196-205. doi: 10.1016/j.bpj.2009.09.031. Biophys J. 2009. PMID: 20006957 Free PMC article.
-
Variational Bayes analysis of a photon-based hidden Markov model for single-molecule FRET trajectories.Biophys J. 2012 Sep 19;103(6):1315-24. doi: 10.1016/j.bpj.2012.07.047. Biophys J. 2012. PMID: 22995504 Free PMC article.
-
Latent-space variational bayes.IEEE Trans Pattern Anal Mach Intell. 2008 Dec;30(12):2236-42. doi: 10.1109/TPAMI.2008.157. IEEE Trans Pattern Anal Mach Intell. 2008. PMID: 18988955
-
A practical guide to single-molecule FRET.Nat Methods. 2008 Jun;5(6):507-16. doi: 10.1038/nmeth.1208. Nat Methods. 2008. PMID: 18511918 Free PMC article. Review.
-
RNA folding dynamics by single-molecule fluorescence resonance energy transfer.Methods. 2009 Oct;49(2):112-7. doi: 10.1016/j.ymeth.2009.04.017. Epub 2009 May 4. Methods. 2009. PMID: 19409995 Review.
Cited by
-
smFRET studies of the 'encounter' complexes and subsequent intermediate states that regulate the selectivity of ligand binding.FEBS Lett. 2014 Oct 1;588(19):3526-38. doi: 10.1016/j.febslet.2014.07.013. Epub 2014 Jul 24. FEBS Lett. 2014. PMID: 25066296 Free PMC article. Review.
-
Single-molecule dataset (SMD): a generalized storage format for raw and processed single-molecule data.BMC Bioinformatics. 2015 Jan 16;16(1):3. doi: 10.1186/s12859-014-0429-4. BMC Bioinformatics. 2015. PMID: 25591752 Free PMC article.
-
Observation and Analysis of RAD51 Nucleation Dynamics at Single-Monomer Resolution.Methods Enzymol. 2018;600:201-232. doi: 10.1016/bs.mie.2017.12.008. Epub 2018 Feb 1. Methods Enzymol. 2018. PMID: 29458759 Free PMC article.
-
Hierarchically-coupled hidden Markov models for learning kinetic rates from single-molecule data.JMLR Workshop Conf Proc. 2013;28(2):361-369. Epub 2013 May 5. JMLR Workshop Conf Proc. 2013. PMID: 26985282 Free PMC article.
-
Precisely and Accurately Inferring Single-Molecule Rate Constants.Methods Enzymol. 2016;581:187-225. doi: 10.1016/bs.mie.2016.08.021. Epub 2016 Oct 7. Methods Enzymol. 2016. PMID: 27793280 Free PMC article.
References
Publication types
MeSH terms
Substances
Grants and funding
LinkOut - more resources
Full Text Sources
