

A machine learning pipeline for quantitative phenotype prediction from genotype data
- PMID: 21034428
- PMCID: PMC2966290
- DOI: 10.1186/1471-2105-11-S8-S3
A machine learning pipeline for quantitative phenotype prediction from genotype data
Abstract
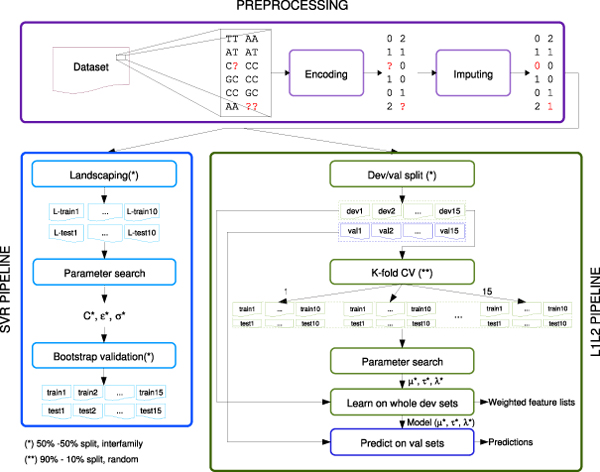
Background: Quantitative phenotypes emerge everywhere in systems biology and biomedicine due to a direct interest for quantitative traits, or to high individual variability that makes hard or impossible to classify samples into distinct categories, often the case with complex common diseases. Machine learning approaches to genotype-phenotype mapping may significantly improve Genome-Wide Association Studies (GWAS) results by explicitly focusing on predictivity and optimal feature selection in a multivariate setting. It is however essential that stringent and well documented Data Analysis Protocols (DAP) are used to control sources of variability and ensure reproducibility of results. We present a genome-to-phenotype pipeline of machine learning modules for quantitative phenotype prediction. The pipeline can be applied for the direct use of whole-genome information in functional studies. As a realistic example, the problem of fitting complex phenotypic traits in heterogeneous stock mice from single nucleotide polymorphims (SNPs) is here considered.
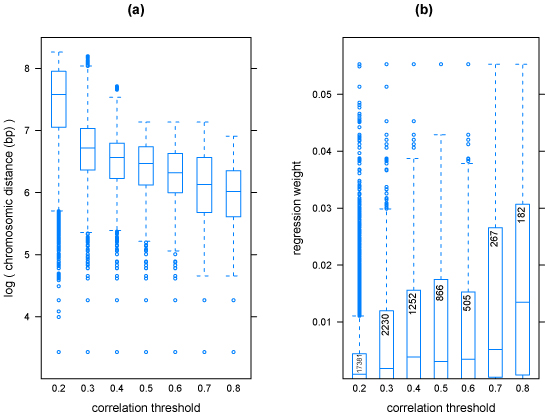
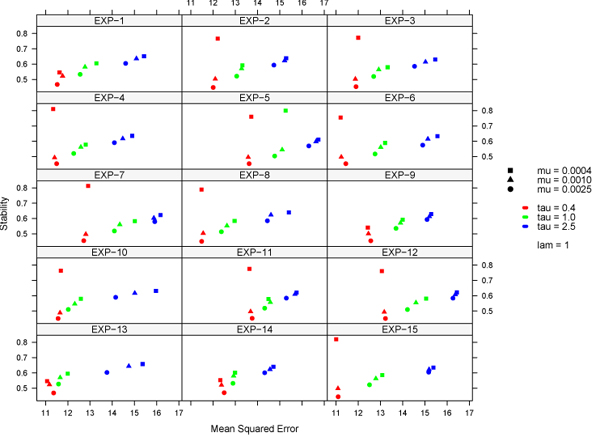
Methods: The core element in the pipeline is the L1L2 regularization method based on the naïve elastic net. The method gives at the same time a regression model and a dimensionality reduction procedure suitable for correlated features. Model and SNP markers are selected through a DAP originally developed in the MAQC-II collaborative initiative of the U.S. FDA for the identification of clinical biomarkers from microarray data. The L1L2 approach is compared with standard Support Vector Regression (SVR) and with Recursive Jump Monte Carlo Markov Chain (MCMC). Algebraic indicators of stability of partial lists are used for model selection; the final panel of markers is obtained by a procedure at the chromosome scale, termed 'saturation', to recover SNPs in Linkage Disequilibrium with those selected.
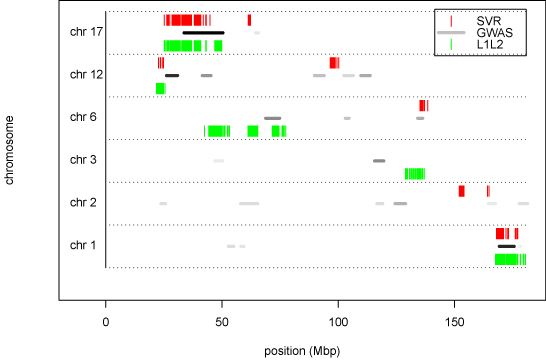
Results: With respect to both MCMC and SVR, comparable accuracies are obtained by the L1L2 pipeline. Good agreement is also found between SNPs selected by the L1L2 algorithms and candidate loci previously identified by a standard GWAS. The combination of L1L2-based feature selection with a saturation procedure tackles the issue of neglecting highly correlated features that affects many feature selection algorithms.
Conclusions: The L1L2 pipeline has proven effective in terms of marker selection and prediction accuracy. This study indicates that machine learning techniques may support quantitative phenotype prediction, provided that adequate DAPs are employed to control bias in model selection.
Figures
References
-
- Casci T. Fitting phenotypes. Nature Reviews Genetics. 2008;9:896–897. doi: 10.1038/nrg2495. - DOI
-
- Cupples LA, Beyene J, Bickeboller H, Daw EW, Fallin MD, Gauderman WJ, Ghosh S, Goode E, Hauser E, Hinrichs A, Kent J, Martin L, Martinez M, Neuman R, Province M, Szymczak S, Wilcox M, Ziegler A, MacCluer J, Almasy L. Genetic Analysis Workshop 16: Strategies for genome-wide association study analyses. BMC Proceedings. 2009;3(Suppl 7):S1. doi: 10.1186/1753-6561-3-s7-s1. - DOI - PMC - PubMed
-
- Wooten E, Iyer L, Montefusco M, Hedgepeth A, Payne D, Kapur N, Housman D, Mendelsohn M, Huggins G. Application of Gene Network Analysis Techniques Identifies AXIN1/PDIA2 and Endoglin Haplotypes Associated with Bicuspid Aortic Valve. PLoS ONE. 2010;5:e8830. doi: 10.1371/journal.pone.0008830. - DOI - PMC - PubMed
Publication types
MeSH terms
Substances
LinkOut - more resources
Full Text Sources
Other Literature Sources
Research Materials
