. 2010 Oct 29;11(1):150.
doi: 10.1186/1465-9921-11-150.

Smoking-mediated up-regulation of GAD67 expression in the human airway epithelium

Affiliations

Smoking-mediated up-regulation of GAD67 expression in the human airway epithelium

Guoqing Wang et al. Respir Res. .

Abstract

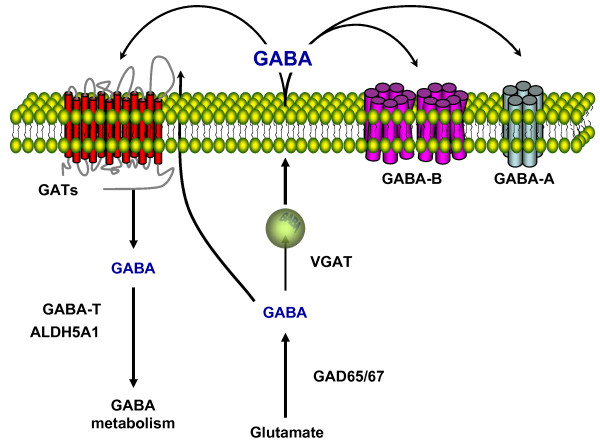
Background: The production of gamma-amino butyric acid (GABA) is dependent on glutamate decarboxylases (GAD65 and GAD67), the enzymes that catalyze the decarboxylation of glutamate to GABA. Based on studies suggesting a role of the airway epithelial GABAergic system in asthma-related mucus overproduction, we hypothesized that cigarette smoking, another disorder associated with increased mucus production, may modulate GABAergic system-related gene expression levels in the airway epithelium.

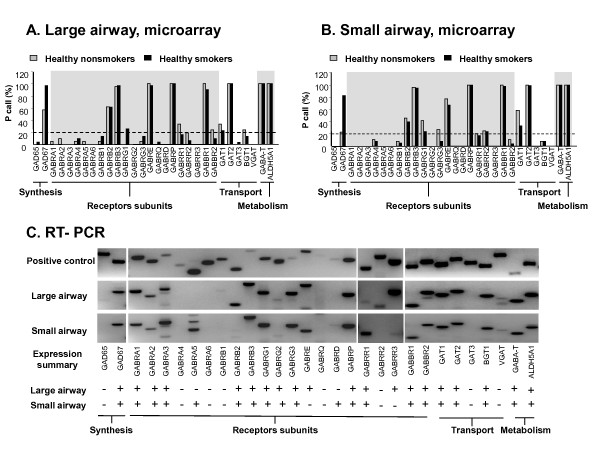
Methods: We assessed expression of the GABAergic system in human airway epithelium obtained using bronchoscopy to sample the epithelium and microarrays to evaluate gene expression. RT-PCR was used to confirm gene expression of GABAergic system gene in large and small airway epithelium from heathy nonsmokers and healthy smokers. The differences in the GABAergic system gene was further confirmed by TaqMan, immunohistochemistry and Western analysis.

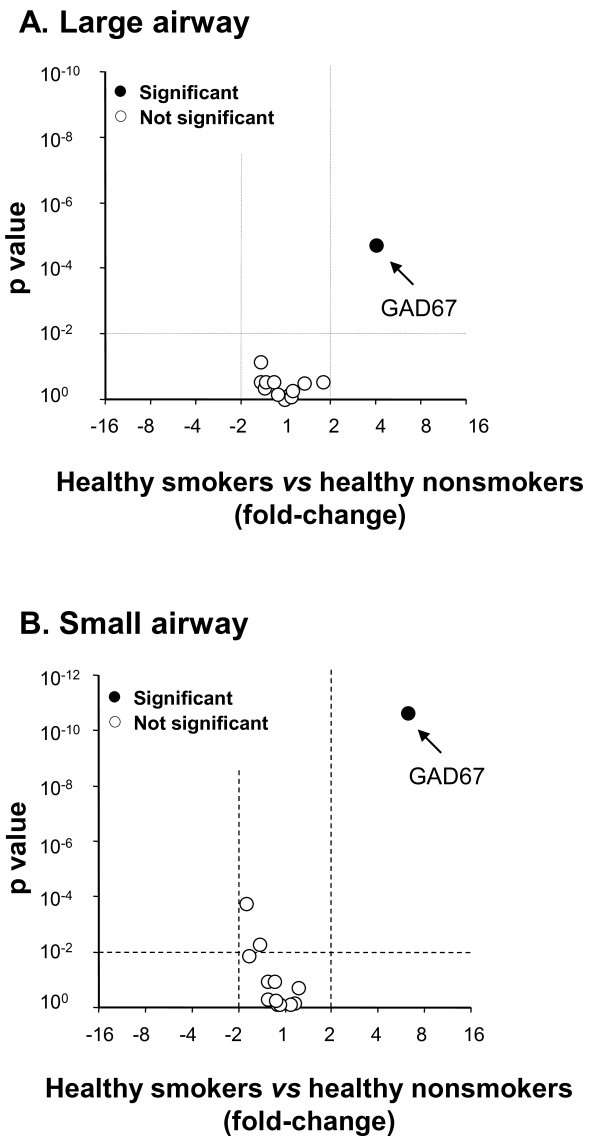
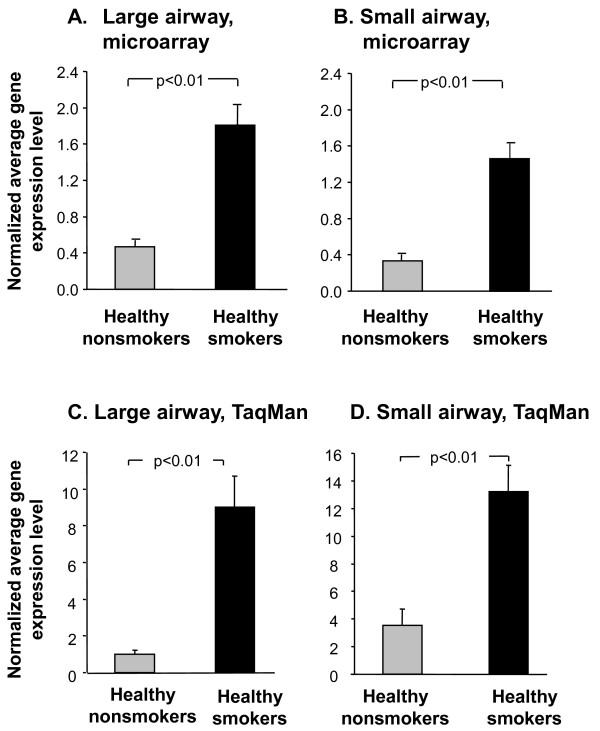
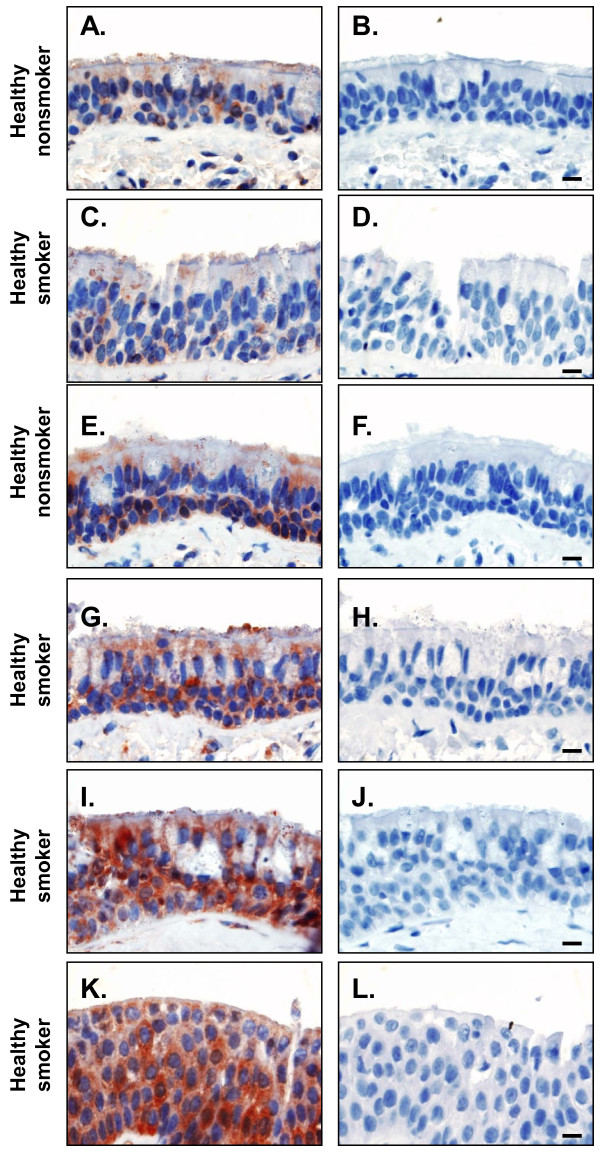
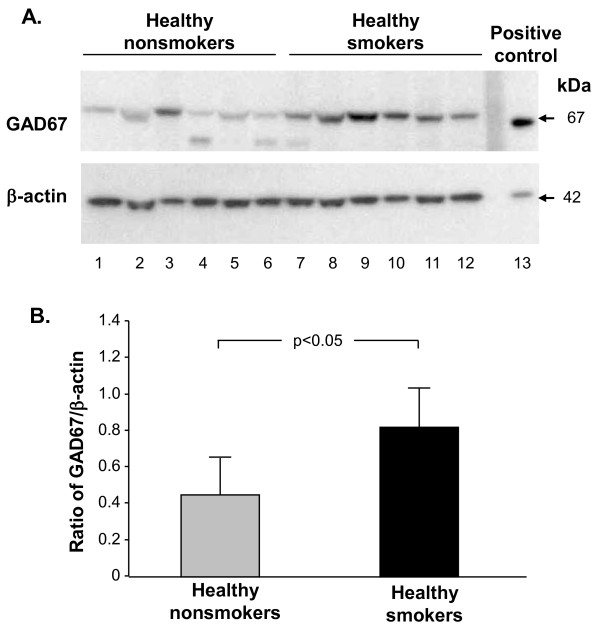
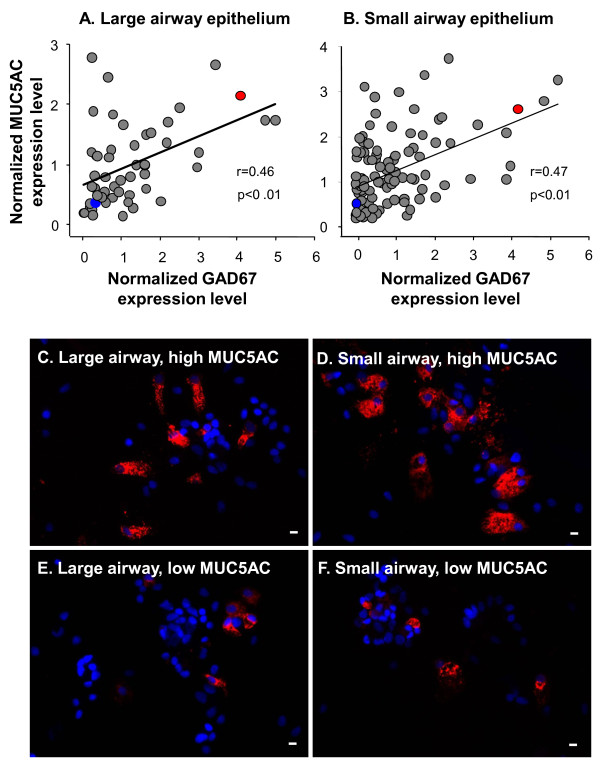
Results: The data demonstrate there is a complete GABAergic system expressed in the large and small human airway epithelium, including glutamate decarboxylase, GABA receptors, transporters and catabolism enzymes. Interestingly, of the entire GABAergic system, smoking modified only the expression of GAD67, with marked up-regulation of GAD67 gene expression in both large (4.1-fold increase, p < 0.01) and small airway epithelium of healthy smokers (6.3-fold increase, p < 0.01). At the protein level, Western analysis confirmed the increased expression of GAD67 in airway epithelium of healthy smokers compared to healthy nonsmokers (p < 0.05). There was a significant positive correlation between GAD67 and MUC5AC gene expression in both large and small airway epithelium (p < 0.01), implying a link between GAD67 and mucin overproduction in association with smoking.

Conclusions: In the context that GAD67 is the rate limiting enzyme in GABA synthesis, the correlation of GAD67 gene expression with MUC5AC expressions suggests that the up-regulation of airway epithelium expression of GAD67 may contribute to the increase in mucus production observed in association with cigarette smoking.

Trial registration: NCT00224198; NCT00224185.


Figures

Figure 1
Figure 1
Schematic illustration of GABAergic system. GABA is synthesized from glutamate by the glutamic acid decarboxylases GAD67 and GAD65. GABA is released by either a vesicle-mediated process, a vesicular neurotransmitter transporter (VGAT) or a nonvesicular process by reverse transport. GABA exerts its physiological effects through GABA-A and GABA-B receptors. The GABAergic signal is terminated by rapid uptake of GABA by specific high affinity GABA transporters (GATs). There are 4 distinct genes encoding GABA membrane transporters, GAT-1, GAT-2, GAT-3 and BGT-1. GABA is metabolized by GABA transaminase (GABA-T) and succinic semialdehyde dehydrogenase (ALDH5A1).
Figure 2
Figure 2
GABAergic system gene expression in large and small airway epithelium. A. Microarray present call analysis of GABAergic system genes in large airway epithelium. B. Microarray present call analysis of GABAergic system genes in small airway epithelium. For A and B, the dashed line represents P call of 20%. C. RT-PCR assessment of GABAergic system gene expression in large and small airway epithelium. Human brain RNA was used as a positive control. Shown are representative RT-PCR results of 1 large airway epithelium sample and 1 small airway epithelium sample.
Figure 3
Figure 3
Microarray assessment of smoking-induced change in GABAergic system gene expression in large and small airway epithelium. A. Volcano plot of GABAergic system gene-related probe sets in large airway epithelium. B. Volcano plot of GABAergic system gene-related probe sets in small airway epithelium. For both panels, the x-axis corresponds to the fold-change and the y-axis corresponds to p value. Black dots represent significant differentially expressed probe sets; open dots represent probe sets with no significant difference between healthy smokers and healthy nonsmokers. The changes in gene expression were considered significant based on the criteria of fold-change >2, p < 0.01, with Benjamini-Hochberg correction
Figure 4
Figure 4
GAD67 gene expression levels in large and small airway epithelium of healthy smokers compared to healthy nonsmokers. A. Average normalized gene expression levels of GAD67, assessed using HG-U133 Plus 2.0 microarray in large airway epithelium of 21 healthy nonsmokers and 31 healthy smokers. The ordinate shows the average normalized gene expression levels for GAD67. B. Average normalized gene expression levels of GAD67, assessed using HG-U133 Plus 2.0 microarray in small airway epithelium of 47 healthy nonsmokers and 58 healthy smokers. C. TaqMan confirmation of changes in GAD67 gene expression levels in large airways of 10 healthy nonsmokers and 12 healthy smokers. D. TaqMan confirmation of changes in GAD67 gene expression levels in small airways of 10 healthy nonsmokers and 12 healthy smokers. The ordinate shows average gene expression levels and error bars represent standard error.
Figure 5
Figure 5
Immunohistochemistry assessment of GAD67 expression in large airway epithelium in healthy nonsmokers and healthy smokers, representing the broad range of up-regulation of the GAD67 gene. Panels A, C, E, G, I, K, stained with anti-GAD67 antibody. Panels B, D, F, H, J, L, stained with mouse IgG control. A. Healthy nonsmoker, anti-GAD67; B. Healthy nonsmoker, IgG; C. Healthy smoker, anti-GAD67; D. Healthy smoker, IgG; E. Healthy nonsmoker, anti-GAD67; F. Healthy nonsmoker, IgG; G. Healthy smoker, anti-GAD67; H. Healthy smoker, IgG; I. Healthy smoker, anti-GAD67; J. Healthy smoker, IgG; K. Healthy smoker, anti-GAD67; and L. Healthy smoker, IgG l. Bar = 10 μm.
Figure 6
Figure 6
Western analysis of GAD67 protein expression in small airway epithelium of healthy nonsmokers and healthy smokers. A. Upper panel - GAD67 protein expression in nonsmokers (lanes 1-6), smokers (lanes 7-12) and positive control (lane 13). Lower panel - same gel probed with anti β-actin antibody; 20 μg protein loaded per well. B. Ratio of GAD67 to β-actin. The ratio of GAD67 to β-actin is represented on the ordinate for smoker and nonsmoker bands. Error bars represent the standard error. Note in panel A, the variability in relative up-regulation of GAD67 in the smokers, similar to that observed at the mRNA level and with immunohistochemistry.
Figure 7
Figure 7
Association of GAD67 gene expression and MUC5AC expression. A, B. Correlation between GAD67 and MUC5AC gene expression in the large and small airway epithelium (Pearson's correlation). A. Average normalized gene expression levels of GAD67 vs MUC5AC gene expression in the large airway epithelium. B. Average normalized gene expression levels of GAD67 vs MUC5AC gene expression in the small airway epithelium. C-F. Representative MUC5AC staining on large and small airway epithelial cells from healthy smokers with high GAD67 and high MUC5AC gene expression or with low GAD67 and low MUC5AC gene expression at mRNA level. "High" or "low" gene expression is defined in Methods and based on microarray data. C. MUC5AC staining on large airway brushed cells of healthy smokers with high GAD67 and high MUC5AC gene expression (marked as red solid circles in panel A). D. MUC5AC staining on small airway brushed cells of healthy smokers with high GAD67 and high MUC5AC gene expression (marked as red solid circles in panel B). E. MUC5AC staining on large airway brushed cells of healthy smokers with low GAD67 and low MUC5AC gene expression (marked as blue solid circles in panel A). F. MUC5AC staining on small airway brushed cells of healthy smokers with low GAD67 and low MUC5AC gene expression (marked as blue solid circles in panel B). In all panels, IgG controls showed no MUC5AC staining (not shown). Bar = 10 μm.

Similar articles

Cited by

References

    1. Tillakaratne NJ, Medina-Kauwe L, Gibson KM. Gamma-aminobutyric acid (GABA) metabolism in mammalian neural and nonneural tissues. Comp Biochem Physiol A Physiol. 1995;112:247–263. doi: 10.1016/0300-9629(95)00099-2. - DOI - PubMed
    1. Owens DF, Kriegstein AR. Is there more to GABA than synaptic inhibition? Nat Rev Neurosci. 2002;3:715–727. doi: 10.1038/nrn919. - DOI - PubMed
    1. Watanabe M, Maemura K, Kanbara K, Tamayama T, Hayasaki H. GABA and GABA receptors in the central nervous system and other organs. Int Rev Cytol. 2002;213:1–47. full_text. - PubMed
    1. Ong J, Kerr DI. GABA-receptors in peripheral tissues. Life Sci. 1990;46:1489–1501. doi: 10.1016/0024-3205(90)90421-M. - DOI - PubMed
    1. Dicpinigaitis PV, Spungen AM, Bauman WA, Absgarten A, Almenoff PL. Inhibition of bronchial hyperresponsiveness by the GABA-agonist baclofen. Chest. 1994;106:758–761. doi: 10.1378/chest.106.3.758. - DOI - PubMed

Publication types

Associated data