

pplacer: linear time maximum-likelihood and Bayesian phylogenetic placement of sequences onto a fixed reference tree
- PMID: 21034504
- PMCID: PMC3098090
- DOI: 10.1186/1471-2105-11-538
pplacer: linear time maximum-likelihood and Bayesian phylogenetic placement of sequences onto a fixed reference tree
Abstract
Background: Likelihood-based phylogenetic inference is generally considered to be the most reliable classification method for unknown sequences. However, traditional likelihood-based phylogenetic methods cannot be applied to large volumes of short reads from next-generation sequencing due to computational complexity issues and lack of phylogenetic signal. "Phylogenetic placement," where a reference tree is fixed and the unknown query sequences are placed onto the tree via a reference alignment, is a way to bring the inferential power offered by likelihood-based approaches to large data sets.
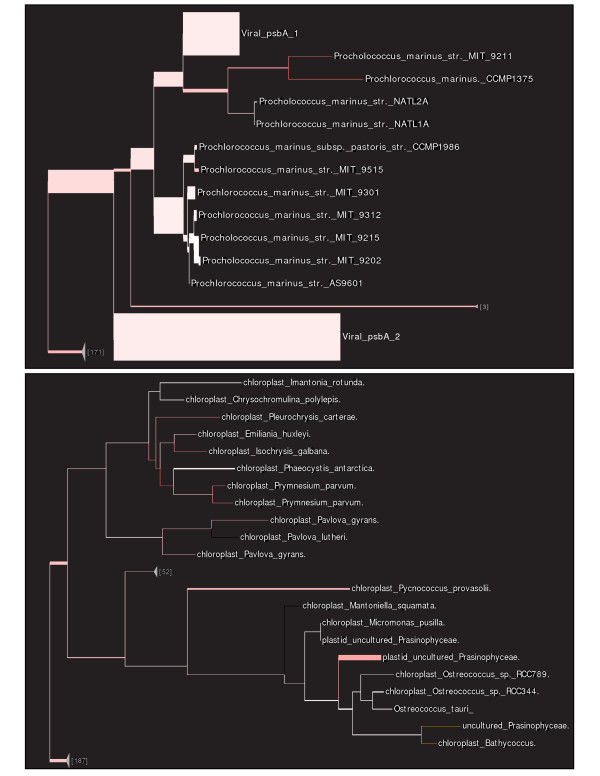
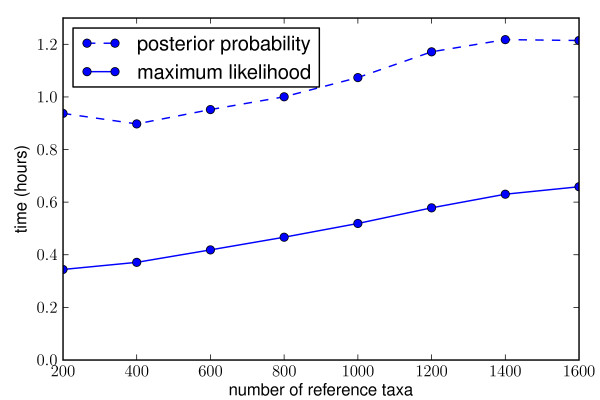
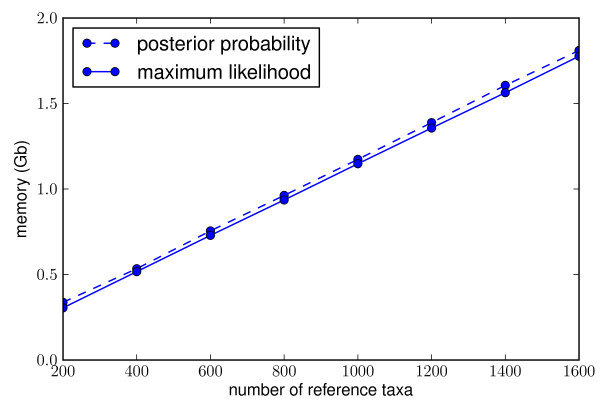
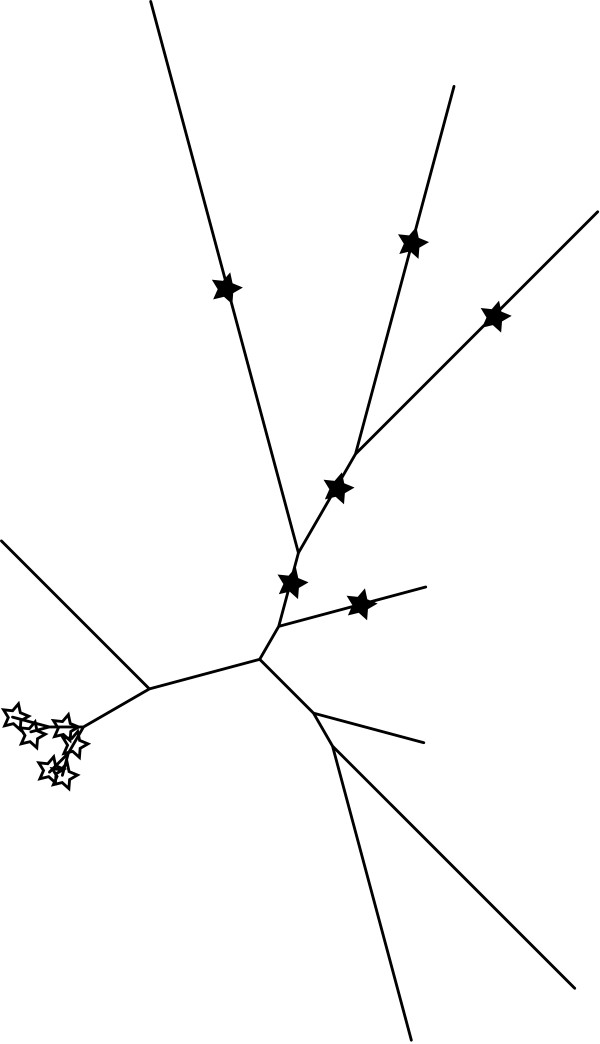
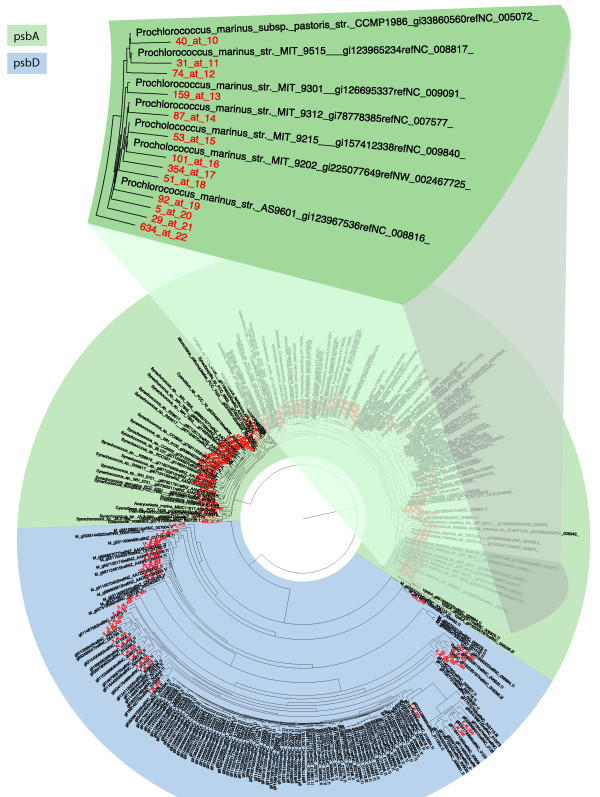
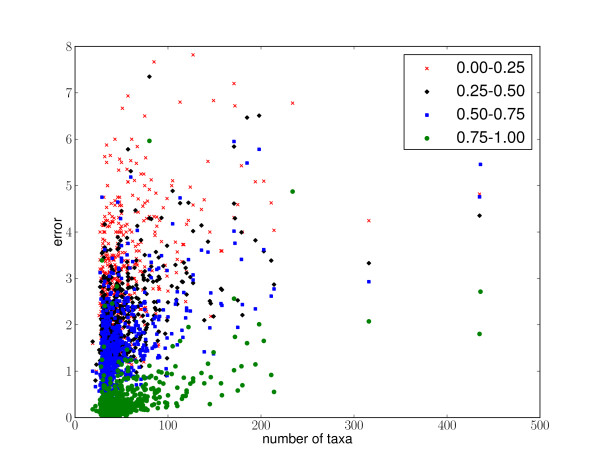
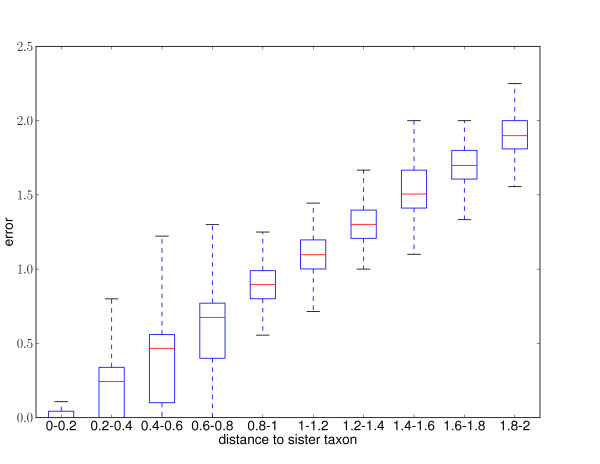
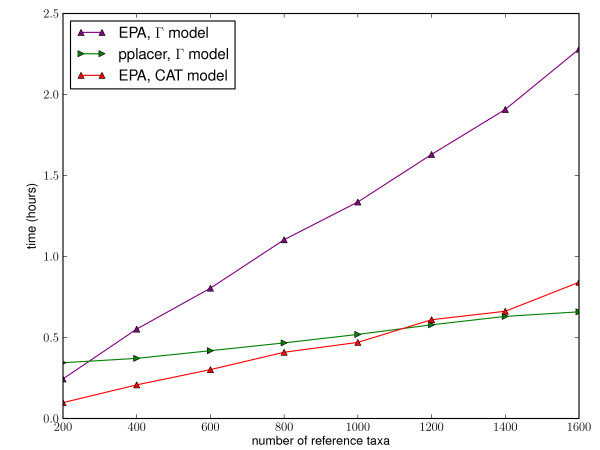
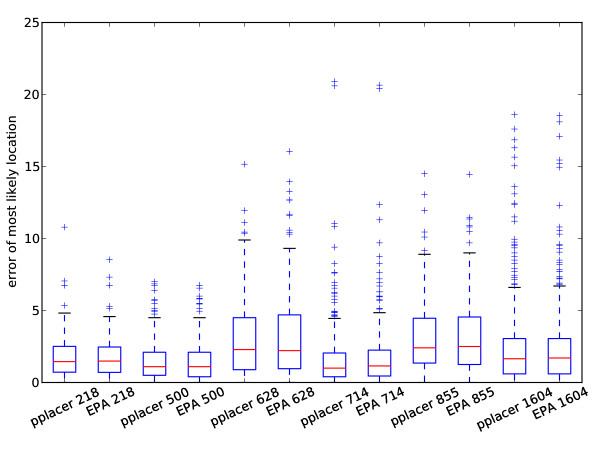
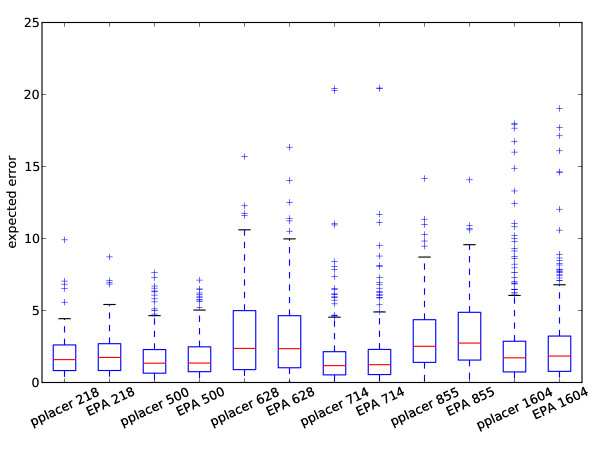
Results: This paper introduces pplacer, a software package for phylogenetic placement and subsequent visualization. The algorithm can place twenty thousand short reads on a reference tree of one thousand taxa per hour per processor, has essentially linear time and memory complexity in the number of reference taxa, and is easy to run in parallel. Pplacer features calculation of the posterior probability of a placement on an edge, which is a statistically rigorous way of quantifying uncertainty on an edge-by-edge basis. It also can inform the user of the positional uncertainty for query sequences by calculating expected distance between placement locations, which is crucial in the estimation of uncertainty with a well-sampled reference tree. The software provides visualizations using branch thickness and color to represent number of placements and their uncertainty. A simulation study using reads generated from 631 COG alignments shows a high level of accuracy for phylogenetic placement over a wide range of alignment diversity, and the power of edge uncertainty estimates to measure placement confidence.
Conclusions: Pplacer enables efficient phylogenetic placement and subsequent visualization, making likelihood-based phylogenetics methodology practical for large collections of reads; it is freely available as source code, binaries, and a web service.
Figures
Similar articles
-
SEPP: SATé-enabled phylogenetic placement.Pac Symp Biocomput. 2012:247-58. doi: 10.1142/9789814366496_0024. Pac Symp Biocomput. 2012. PMID: 22174280
-
Bayesian coestimation of phylogeny and sequence alignment.BMC Bioinformatics. 2005 Apr 1;6:83. doi: 10.1186/1471-2105-6-83. BMC Bioinformatics. 2005. PMID: 15804354 Free PMC article.
-
Performance, accuracy, and Web server for evolutionary placement of short sequence reads under maximum likelihood.Syst Biol. 2011 May;60(3):291-302. doi: 10.1093/sysbio/syr010. Epub 2011 Mar 23. Syst Biol. 2011. PMID: 21436105 Free PMC article.
-
SCAMPP: Scaling Alignment-Based Phylogenetic Placement to Large Trees.IEEE/ACM Trans Comput Biol Bioinform. 2023 Mar-Apr;20(2):1417-1430. doi: 10.1109/TCBB.2022.3170386. Epub 2023 Apr 3. IEEE/ACM Trans Comput Biol Bioinform. 2023. PMID: 35471888
-
Inferring trees.Methods Mol Biol. 2008;452:287-309. doi: 10.1007/978-1-60327-159-2_14. Methods Mol Biol. 2008. PMID: 18566770 Review.
Cited by
-
Phylogenetic affiliation of SSU rRNA genes generated by massively parallel sequencing: new insights into the freshwater protist diversity.PLoS One. 2013;8(3):e58950. doi: 10.1371/journal.pone.0058950. Epub 2013 Mar 14. PLoS One. 2013. PMID: 23516585 Free PMC article.
-
Genomic diversity in Paenibacillus polymyxa: unveiling distinct species groups and functional variability.BMC Genomics. 2024 Jul 25;25(1):720. doi: 10.1186/s12864-024-10610-w. BMC Genomics. 2024. PMID: 39054421 Free PMC article.
-
Bacterial communities in women with bacterial vaginosis: high resolution phylogenetic analyses reveal relationships of microbiota to clinical criteria.PLoS One. 2012;7(6):e37818. doi: 10.1371/journal.pone.0037818. Epub 2012 Jun 18. PLoS One. 2012. PMID: 22719852 Free PMC article.
-
Metagenomic approaches in microbial ecology: an update on whole-genome and marker gene sequencing analyses.Microb Genom. 2020 Aug;6(8):mgen000409. doi: 10.1099/mgen.0.000409. Epub 2020 Jul 24. Microb Genom. 2020. PMID: 32706331 Free PMC article. Review.
-
Utilization of heme as an iron source by marine Alphaproteobacteria in the Roseobacter clade.Appl Environ Microbiol. 2013 Sep;79(18):5753-62. doi: 10.1128/AEM.01562-13. Epub 2013 Jul 19. Appl Environ Microbiol. 2013. PMID: 23872569 Free PMC article.
References
Publication types
MeSH terms
LinkOut - more resources
Full Text Sources
Other Literature Sources
Molecular Biology Databases
