Comparative Study
. 2011 Feb-Mar;60(2-3):423-31.
doi: 10.1016/j.neuropharm.2010.10.015. Epub 2010 Oct 27.

Apotransferrin protects cortical neurons from hemoglobin toxicity

Affiliations
Comparative Study

Apotransferrin protects cortical neurons from hemoglobin toxicity

Jing Chen-Roetling et al. Neuropharmacology. 2011 Feb-Mar.

Abstract

The protective effect of iron chelators in experimental models of intracerebral hemorrhage suggests that nonheme iron may contribute to injury to perihematomal cells. Therapy with high affinity iron chelators is limited by their toxicity, which may be due in part to sequestration of metals in an inaccessible complex. Transferrin is unique in chelating iron with very high affinity while delivering it to cells as needed via receptor-mediated endocytosis. However, its efficacy against iron-mediated neuronal injury has never been described, and was therefore evaluated in this study using an established cell culture model of hemoglobin neurotoxicity. At concentrations similar to that of CSF transferrin (50-100 micrograms/ml), both iron-saturated holotransferrin and apotransferrin were nontoxic per se. Overnight exposure to 3 μM purified human hemoglobin in serum-free culture medium resulted in death, as measured by lactate dehydrogenase release assay, of about three-quarters of neurons. Significant increases in culture iron, malondialdehyde, protein carbonyls, ferritin and heme oxygenase-1 were also observed. Holotransferrin had no effect on these parameters, but all were attenuated by 50-100 micrograms/ml apotransferrin. The effect of apotransferrin was very similar to that of deferoxamine at a concentration that provided equivalent iron binding capacity, and was not antagonized by concomitant treatment with holotransferrin. Transferrin receptor-1 expression was localized to neurons and was not altered by hemoglobin or transferrin treatment. These results suggest that apotransferrin may mitigate the neurotoxicity of hemoglobin after intracerebral hemorrhage. Increasing its concentration in perihematomal tissue may be beneficial.


Figures

Fig. 1
Fig. 1
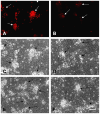
Morphologic appearance of cultures treated with hemoglobin alone or with transferrins. Immunofluorescence (A,B) and phase contrast (C–F) photomicrographs of cultures 16 hours after the following treatments: A,C) sham medium exchange only; neurons (arrows) are easily distinguished from the background glial monolayer by their prominent phase-bright cell bodies, which are immunoreactive for NeuN; B,D) 3 μM hemoglobin (Hb); most neurons have degenerated to debris, reducing NeuN immunoreactivity; E) Hb 3 μM plus apotransferrin 50 μg/ml; morphology of neurons is preserved; F) Hb 3 μM plus holotransferrin 50 μg/ml; no protection is apparent. Scale bar = 100μm.
Fig. 2
Fig. 2
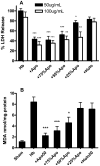
Apotransferrin but not holotransferrin protects cortical neurons from hemoglobin. A) Culture medium LDH activity (± S.E.M, n = 21–25/condition) after 16 hour treatment with hemoglobin (Hb) 3 μM alone, with 50 μg/ml (0.625 μM) apotransferrin (Apo) or holotransferrin (Holo), or with 1.25 μM deferoxamine (DFO), which has the same iron binding capacity as 0.625 μM apotransferrin. Medium LDH values are scaled to those in sister cultures treated with NMDA 300 μM (=100), which releases all neuronal LDH without injuring glial cells. The weak signal in sister cultures subjected to medium exchange only (sham) was subtracted from all values to yield the LDH activity associated with neurotoxicity. B) Cultures (10–14/condition) were treated as in A, and were assayed for malondialdehyde (MDA) at the end of the exposure period. ***P < 0.001 v. Hb-treated cultures, Bonferroni multiple comparisons test.
Fig. 3
Fig. 3
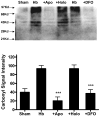
Apotransferrin attenuates protein oxidation by hemoglobin. Immunoblot of proteins from cortical cultures 16 hours after treatment with 3 μM hemoglobin (Hb) alone, with 50 μg/ml (0.625 μM) apotransferrin or holotransferrin, with 1.25 μM deferoxamine (DFO), or medium exchange only (sham), stained with antibody to derivatized carbonyl groups. Bars represent mean lane densities (± S.E.M.) after background subtraction. ***P < 0.001 v. mean signal in Hb alone group, Bonferroni multiple comparisons test, n = 3–6 cultures/condition.
Fig. 4
Fig. 4
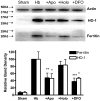
Apotransferrin attenuates ferritin and heme oxygenase-1 expression after hemoglobin treatment. Bars represent mean band density (± S.E.M.) after 16 h treatment with 3 μM hemoglobin (Hb) alone or with 50 μg/ml (0.625 μM) apotransferrin or holotransferrin, with 1.25 μM deferoxamine (DFO), or medium exchange only (sham). Lane order of representative immunoblots stained with antibodies to actin (gel loading control), ferritin, or heme oxygenase-1 is the same as bar order. *P < 0.05, ***P < 0.01, ***P < 0.001 v. mean signal in corresponding Hb alone group, Bonferroni multiple comparisons test, n = 3–5 cultures/condition.
Fig. 5
Fig. 5
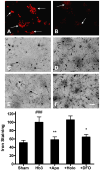
Apotransferrin attenuates iron deposition in hemoglobin-treated cultures. Immunofluorescence and bright field photomicrographs of cultures fixed 16 hours after the following treatments: A,C) sham medium exchange only; iron staining is limited to the glial monolayer, and NeuN-positive neuronal cell bodies (arrows) are Perl’s negative; B,D) Hb 3 μM; iron staining in both glial monolayer and degenerating neuronal cell bodies is apparent; NeuN immunoreactivity is diminished; E) Hb 3 μM plus 50 μg/ml apotransferrin; F) Hb 3 μM plus 50 μg/ml holotransferrin. Bars represent mean iron staining (± S.E.M.), normalized to that in Hb-alone condition (= 100). Deferoxamine (DFO) concentration was 1.25 μM. *P < 0.05, **P < 0.01, v. mean signal in corresponding Hb alone group, ###P < 0.001 v. signal in sham group, Bonferroni multiple comparisons test, n = 12–14/condition. Scale bar = 100μm.
Fig. 6
Fig. 6
Holotransferrin does not antagonize the protective effect of apotransferrin. A) Culture medium LDH activity (± S.E.M.) after 16-hour treatment with hemoglobin (Hb) 3 μM alone, with 50 μg/ml or 100 μg/ml apotransferrin (+ apo) or holotransferrin (+holo), or with 50 μg/ml or 100 μg/ml total transferrin containing indicated percentage of apotransferrin and balance holotransferrin. Medium LDH values are scaled to those in sister cultures treated with NMDA 300 μM (=100), which releases all neuronal LDH without injuring glial cells. The weak signal in sister cultures subjected to medium exchange only was subtracted from all values to yield the LDH activity associated with neurotoxicity. B) Cultures were treated as in A, using 50 μg/ml total transferrin, and were assayed for malondialdehyde (MDA) at the end of the exposure period. Sham cultures were subjected to medium exchange only. *P < 0.05, **P < 0.01, ***P < 0.001 v. mean signal in corresponding Hb alone group, Bonferroni multiple comparisons test, n = 7–12 cultures/condition.
Fig. 7
Fig. 7
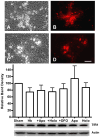
Transferrin receptor-1 (TfR1) expression is not altered by hemoglobin, transferrin or deferoxamine. Phase contrast (A,C) and fluorescent photomicrographs after anti- TfR1 immunostaining (B,D) of sister cultures treated with: A,B) medium exchange (sham) only; prominent phase-bright neuronal cell bodies and adjacent processes express TfR1; C,D) hemoglobin 3 μM for 16h; degenerating neurons continue to express TfR1. Bar graph represents mean TfR1 immunoblot band densities (± S.E.M., n = 6–8/condition) from cultures treated for 16h with hemoglobin (Hb) alone or with apotransferrin (+Apo) 50 μg/ml, holotransferrin (+Holo) 50 μg/ml, deferoxamine (+DFO) 1.25 μM, or with same concentrations of apotransferrin (Apo) or holotransferrin (Holo) alone. Band order of representative immunoblot is the same as bar order. P > 0.05 for all conditions v. sham or Hb alone, Bonferroni multiple comparisons test. Scale bar = 100μm.

References

    1. Balla G, Jacob HS, Balla J, Rosenberg M, Nath K, Apple F, Eaton JW, Vercellotti GM. Ferritin: A cytoprotective strategem of endothelium. J Biol Chem. 1992;267:18148–18153. - PubMed
    1. Benvenisti-Zarom L, Chen-Roetling J, Regan RF. Inhibition of the ERK/MAP kinase pathway attenuates heme oxygenase-1 expression and heme-mediated neuronal injury. Neurosci Lett. 2006;398:230–234. - PubMed
    1. Burdo JR, Antonetti DA, Wolpert EB, Connor JR. Mechanisms and regulation of transferrin and iron transport in a model blood-brain barrier system. Neuroscience. 2003;121:883–890. - PubMed
    1. Chen-Roetling J, Li Z, Chen M, Awe OO, Regan RF. Heme oxygenase activity and hemoglobin neurotoxicity are attenuated by inhibitors of the MEK/ERK pathway. Neuropharmacology. 2009;56:922–928. - PMC - PubMed
    1. Chen-Roetling J, Regan RF. Effect of heme oxygenase-1 on the vulnerability of astrocytes and neurons to hemoglobin. Biochem Biophys Res Commun. 2006;350:233–237. - PMC - PubMed

Publication types

MeSH terms

LinkOut - more resources