. 2010 Nov 12;143(4):639-50.
doi: 10.1016/j.cell.2010.09.048. Epub 2010 Oct 28.

Extensive in vivo metabolite-protein interactions revealed by large-scale systematic analyses

Affiliations

Extensive in vivo metabolite-protein interactions revealed by large-scale systematic analyses

Xiyan Li et al. Cell. .

Abstract

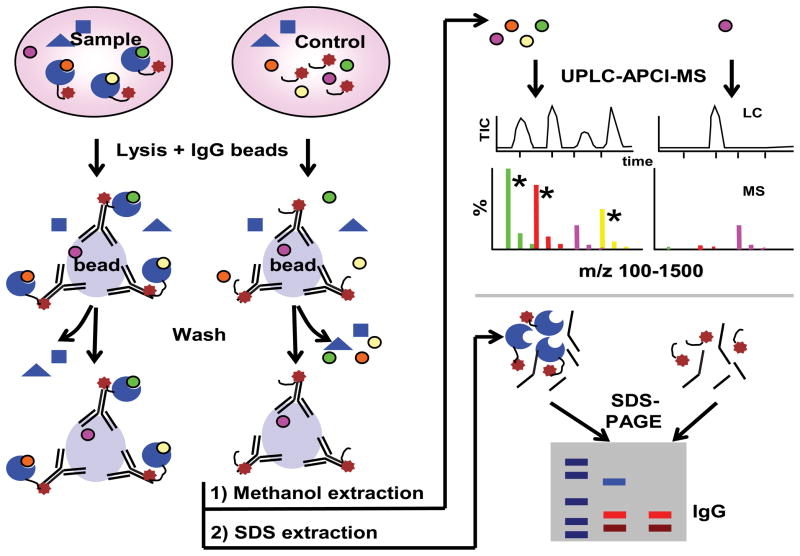
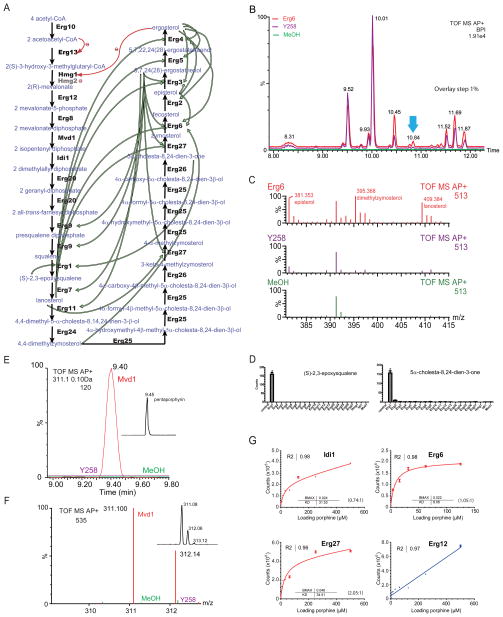
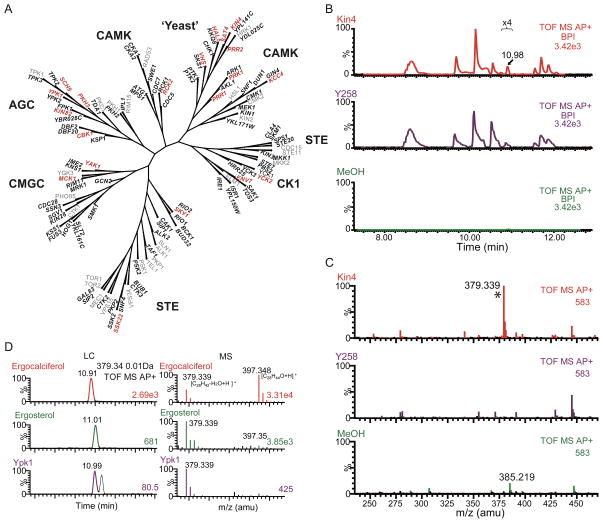
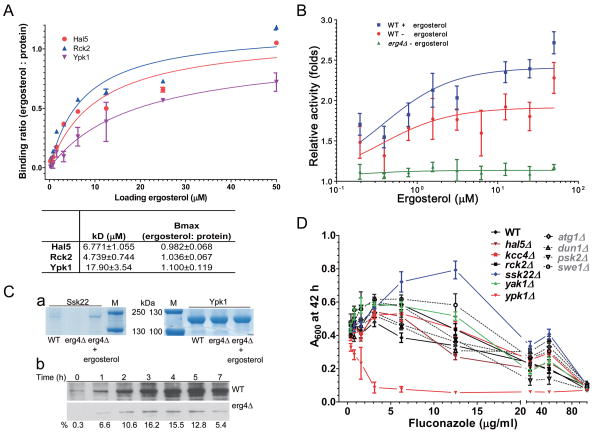
Natural small compounds comprise most cellular molecules and bind proteins as substrates, products, cofactors, and ligands. However, a large-scale investigation of in vivo protein-small metabolite interactions has not been performed. We developed a mass spectrometry assay for the large-scale identification of in vivo protein-hydrophobic small metabolite interactions in yeast and analyzed compounds that bind ergosterol biosynthetic proteins and protein kinases. Many of these proteins bind small metabolites; a few interactions were previously known, but the vast majority are new. Importantly, many key regulatory proteins such as protein kinases bind metabolites. Ergosterol was found to bind many proteins and may function as a general regulator. It is required for the activity of Ypk1, a mammalian AKT/SGK kinase homolog. Our study defines potential key regulatory steps in lipid biosynthetic pathways and suggests that small metabolites may play a more general role as regulators of protein activity and function than previously appreciated.


Figures

Figure 1
Figure 1. Flow chart for the identification small metabolites bound to proteins
Molecules bound to a strain expressing a protein of interest relative to a control stain are identified using the scheme presented. See also Figure S1. and Table S1.
Figure 2
Figure 2. Identification of small metabolites associated with ergosterol biosynthetic proteins
(A) An overview of ergosterol biosynthesis pathway. Substrates and products of the yeast ergosterol biosynthetic pathway (retrieved from MetaCyc with modification) are in blue whereas protein enzymes are in black (included in this study) or gray (not included in this study). Known interactions are linked by red curve labelled with Θ for inhibitory effects. Interactions discovered in this study are indicated by green arrows from a metabolite to a binding protein. (B) LC plots of the small metabolites extracted from a protein (Erg6, red), the negative control (Y258, purple), and the methanol solvent (green), respectively. Base peak intensity (BPI, %) is plotted with retention time (in minute) of corresponding mass spectra (shifted by 1% for clarity). Note BPI peaks are composite, not a good indicator of the intensity of single molecular masses. The 100% BPI in counts is indicated on the graph. All traces were smoothed by the Savitzky-Golay method using 2 passes of window size of 3 scans. (C) Combined average mass spectra of the 10.80–11.20 min region in B (indicated by a blue block arrow). The masses of 3 Erg5-bound small metabolites are indicated along with their chemical identities. The X-axis is the peak mass (amu); the Y-axis is the peak intensity (%). (D) Summary of the average peak intensity of two small metabolites listed in Table 1 extracted from each of the 21 ergosterol biosynthetic proteins (n=5). * indicates statistical significance (two tail t-test, P value<0.01) in comparison with the negative control Y258. Error bar = SEM. (E) An LC plot showing detection of pentaporphyrin I (311.100 amu at 9.40 min) from Mvd1 (red) but not from Y258 (purple) or methanol samples (green). Indent shows the LC of pure pentaporphyrin I. (F) Combined mass spectra of the LC peak region in E. Color labels are as in E. X-axis is shifted by 0.05 amu for clarity. The indent profile shows the mass spectrum of pure pentaporphyrin. (G) In vitro binding curves of pentaporphyrin and Erg proteins. Each binding curve was subject to fitting comparison (P value< 0.01) to a saturable binding curve (specific) or a straight line (non-specific). Binding constants Kd, Bmax and curve fitting R2 are indicated (in μM) on each graph. Stoichiometry (metabolite:protein) is also indicated. See also Fig. S2.
Figure 3
Figure 3. S. cerevisiae protein kinase-small metabolite interaction
(A) A total of 103 of 129 kinases were analyzed in this study. Kinases not tested are indicated in gray. The 20 kinases that bound small metabolites are in red. (B) An LC plot of the small metabolites extracted from a kinase (Kin4, red), the negative control (Y258, purple), and the methanol (green). The focused retention time region (in minute, zoomed in 4x) is indicated above the trace. Graph labels are as in Fig. 2B. (C) Combined average mass spectra of the 10.9 to 11.1 min region in B. Graph label is as in Fig. 2C (n=3 for Kin4; n=9 for Y258 and methanol). The peak corresponding to ergosterol is marked by *. (D) An example showing identification of a bound metabolite as ergosterol. The mass spectra of pure ergosterol, pure ergocalciferol, and one of the small metabolites extracted from protein kinase Ypk1 shown on right and their respective UPLC on left. The elemental composition is indicated respective mass peaks. Graph label is as in B,C. See also Figure S3 and Table S2.
Figure 4
Figure 4. Detailed analysis of several kinase-small metabolite interactions
(A) In vitro binding analysis of ergosterol and several protein kinases. The curve-fitting was done in GraphPad Prism 5. Error bars are SEM (n=3). Statistic comparison of curve fitting between a straight line for non-specific binding (null) vs. one-site specific binding was used to determine specific binding pattern (P value<0.05). The R2 (unweighted) was 0.918, 0.908, and 0.933 for Hal5, Rck2, and Ypk1 respectively. The ergosterol-binding characteristics of their protein kinases are listed below. (B) Protein kinase activity of Ypk1 is stimulated by the addition of ergosterol. Ypk1 protein was purified from wild type (BY4741) cells grown in the presence or absence of 2 mM ergosterol during galactose induction of protein expression, or from ergosterol deficient yeast (erg4Δ). Equal amounts of purified protein were tested in each assay. The relative activity was determined using a Sgk1-specific kinase assay. Error bars=SEM, n=4. (C) Levels of Ssk22 and Ypk1 in yeast. a) Ssk22 and Ypk1 were purified from equal amounts of wild type (BY4741) and ergosterol-lacking mutant (erg4Δ) cells with or without 0.4 mM ergosterol. In 3 independent experiments, Ssk22 cannot be detected in erg4Δ. b) Immunoblot of Ssk22 and Ypk1 from yeast cell lysates over 7-hour after galactose induction. Proteins were probed with rabbit IgG (1:10,000 dilution of 10 mg/ml stock). Equal amounts of protein were loaded; erg4Δ strains produce less protein as indicated by relative abundance listed below (% of wild type). (D) Cell growth (absorption at 600 nm) is affected by the ergosterol-repressing drug fluconazole in mutants of ergosterol binding protein kinases. Error bars are SEM, n=8. Dotted lines and gray legends are mutants of protein kinases that did not bind ergosterol in this study. See also Fig. S4.
Figure 5
Figure 5. Integrative interactomes of proteins and small metabolites
(A) top, A protein-protein interaction network showing intermediate proteins (green circles) that link ergosterol-binding protein kinases (purple diamonds) from this study and ergosterol biosynthetic enzymes through known physical or genetic interactions or common phenotypes (red hexagons), The edge colors denote interaction types: green for physical, blue for genetic and phenotypic, purple for phosphorylation, red for metabolic, olive for transcription factor binding; Middle, A subnetwork showing a group of intermediate proteins phosphorylated by ergosterol-bound protein kinases and regulate ergosterol enzymes through transcription and phosphorylation; Bottom, A subnetwork showing only ubiquitin (Ubi4)-interacting intermediate proteins and ergosterol enzymes. (B) Gene ontology (GO) enrichment analysis of the 137 intermediate proteins in A top (P value <0.01 for hypergeometric test against GOSlim_Yeast). See also Table. S3.

References

    1. Alberts B. Molecular biology of the cell. 4. New York: Garland Science; 2002.
    1. Allen J, Davey HM, Broadhurst D, Heald JK, Rowland JJ, Oliver SG, Kell DB. High-throughput classification of yeast mutants for functional genomics using metabolic footprinting. Nat Biotechnol. 2003;21:692–696. - PubMed
    1. Babu P, Deschenes RJ, Robinson LC. Akr1p-dependent palmitoylation of Yck2p yeast casein kinase 1 is necessary and sufficient for plasma membrane targeting. J Biol Chem. 2004;279:27138–27147. - PubMed
    1. Beloqui A, Guazzaroni ME, Pazos F, Vieites JM, Godoy M, Golyshina OV, Chernikova TN, Waliczek A, Silva-Rocha R, Al-ramahi Y, et al. Reactome Array: Forging a Link Between Metabolome and Genome. Science. 2009;326:252–257. - PubMed
    1. Brazil DP, Hemmings BA. Ten years of protein kinase B signalling: a hard Akt to follow. Trends Biochem Sci. 2001;26:657–664. - PubMed

Publication types

MeSH terms