

Fluorescence-based assay to measure the real-time kinetics of nucleotide incorporation during transcription elongation
- PMID: 21035457
- PMCID: PMC3053063
- DOI: 10.1016/j.jmb.2010.10.020
Fluorescence-based assay to measure the real-time kinetics of nucleotide incorporation during transcription elongation
Abstract
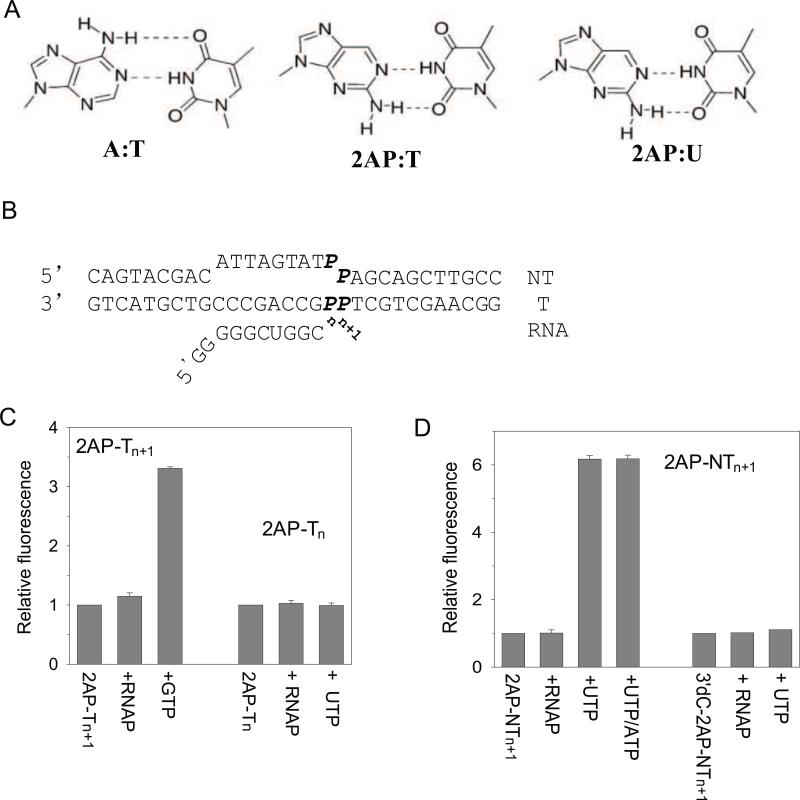
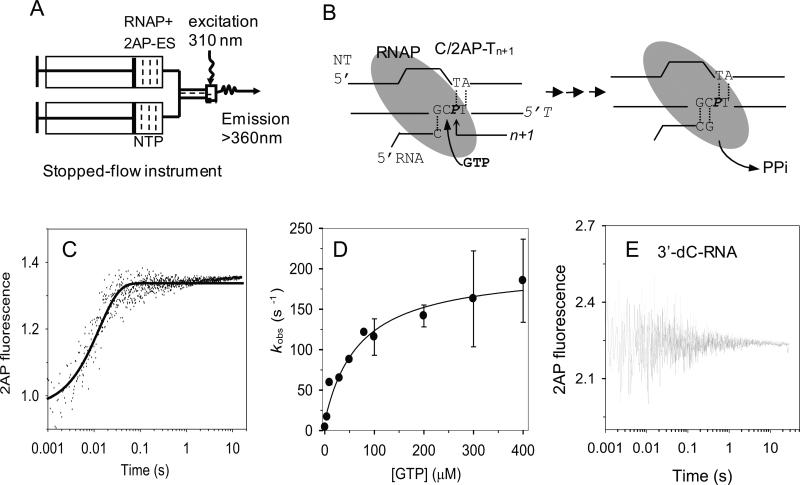
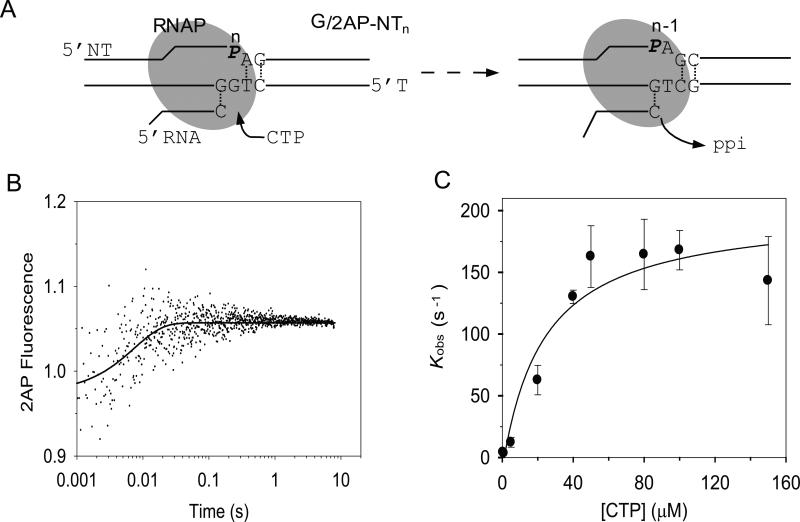
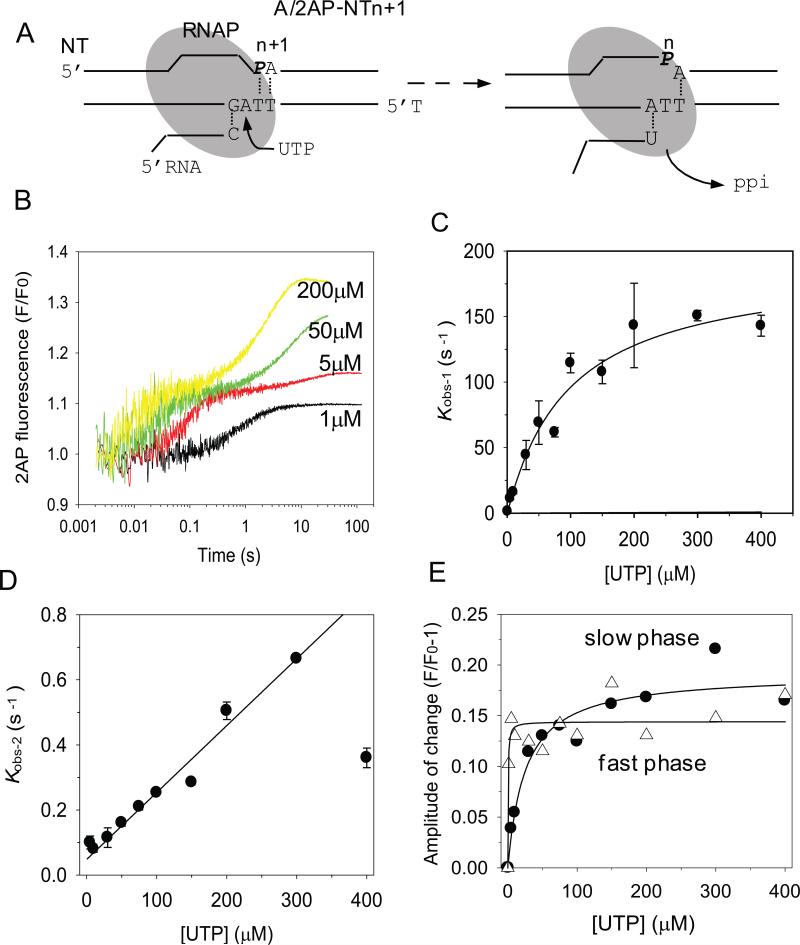
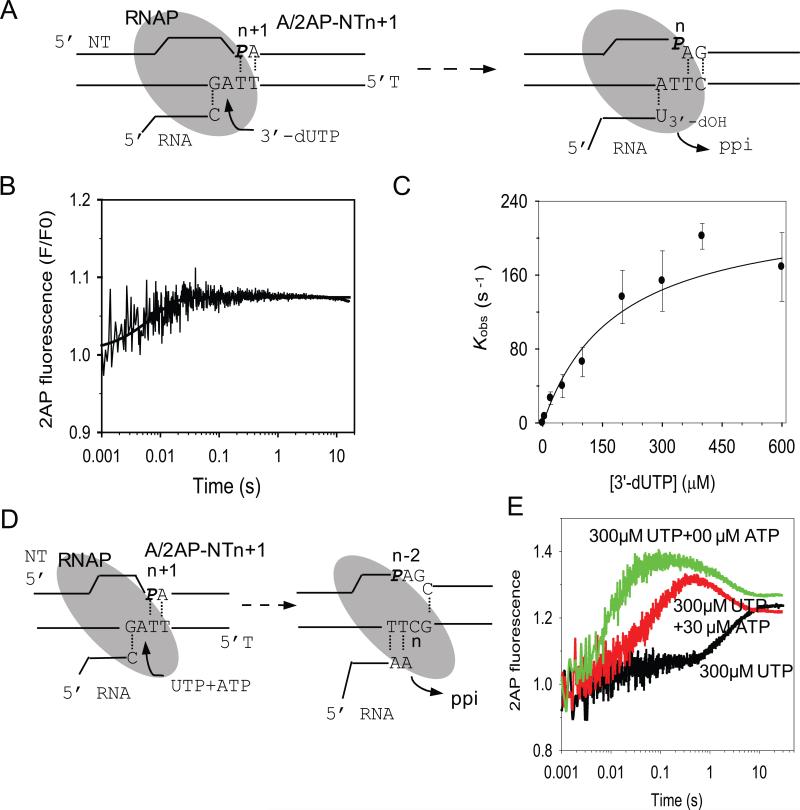
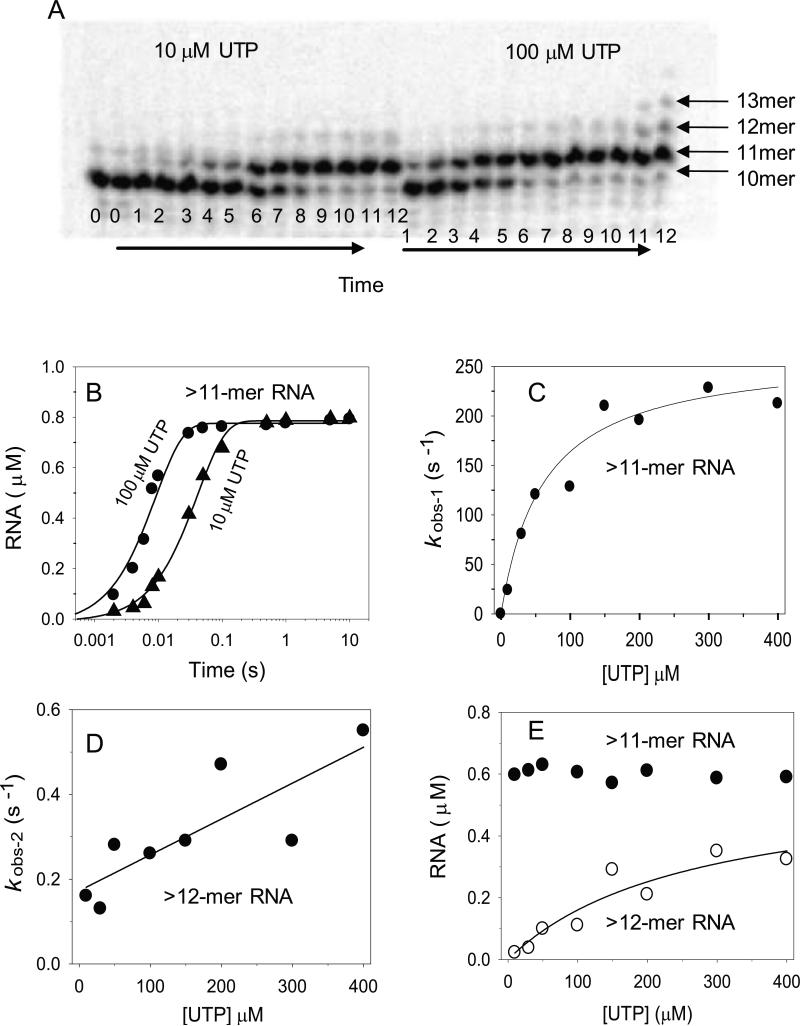
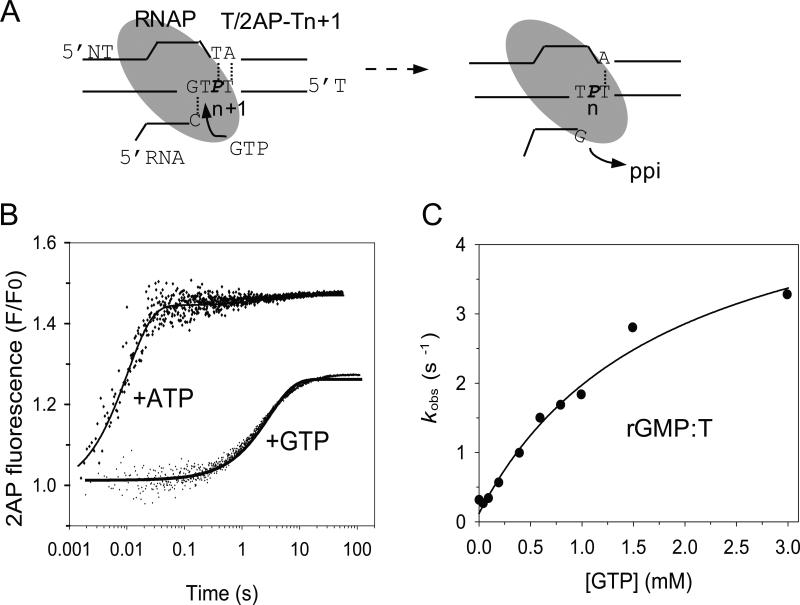
Understanding the mechanism and fidelity of transcription by the RNA polymerase (RNAP) requires measurement of the dissociation constant (K(d)) of correct and incorrect NTPs and their incorporation rate constants (k(pol)). Currently, such parameters are obtained from radiometric-based assays that are both tedious and discontinuous. Here, we report a fluorescence-based assay for measuring the real-time kinetics of single-nucleotide incorporation during transcription elongation. The fluorescent adenine analogue 2-aminopurine was incorporated at various single positions in the template or the nontemplate strand of the promoter-free elongation substrate. On addition of the correct NTP to the T7 RNAP-DNA, 2-aminopurine fluorescence increased rapidly and exponentially with a rate constant similar to the RNA extension rate obtained from the radiometric assay. The fluorescence stopped-flow assay, therefore, provides a high-throughput way to measure the kinetic parameters of RNA synthesis. Using this assay, we report the k(pol) and K(d) of all four correct NTP additions by T7 RNAP, which showed a range of values of 145-190 s(-1) and 28-124 μM, respectively. The fluorescent elongation substrates were used to determine the misincorporation kinetics as well, which showed that T7 RNAP discriminates against incorrect NTP both at the nucleotide binding and incorporation steps. The fluorescence-based assay should be generally applicable to all DNA-dependent RNAPs, as they use similar elongation substrates. It can be used to elucidate the mechanism, fidelity, and sequence dependency of transcription and is a rapid means to screen for inhibitors of RNAPs for therapeutic purposes.
Copyright © 2010 Elsevier Ltd. All rights reserved.
Figures
Similar articles
-
Rapid binding of T7 RNA polymerase is followed by simultaneous bending and opening of the promoter DNA.Biochemistry. 2006 Apr 18;45(15):4947-56. doi: 10.1021/bi052292s. Biochemistry. 2006. PMID: 16605262
-
Transient state kinetics of transcription elongation by T7 RNA polymerase.J Biol Chem. 2006 Nov 24;281(47):35677-85. doi: 10.1074/jbc.M608180200. Epub 2006 Sep 27. J Biol Chem. 2006. PMID: 17005565
-
Fluorescence characterization of the transcription bubble in elongation complexes of T7 RNA polymerase.J Mol Biol. 2001 May 4;308(3):465-75. doi: 10.1006/jmbi.2001.4601. J Mol Biol. 2001. PMID: 11327781
-
The structural changes of T7 RNA polymerase from transcription initiation to elongation.Curr Opin Struct Biol. 2009 Dec;19(6):683-90. doi: 10.1016/j.sbi.2009.09.001. Epub 2009 Oct 5. Curr Opin Struct Biol. 2009. PMID: 19811903 Free PMC article. Review.
-
Visualizing polynucleotide polymerase machines at work.EMBO J. 2006 Aug 9;25(15):3458-68. doi: 10.1038/sj.emboj.7601211. EMBO J. 2006. PMID: 16900098 Free PMC article. Review.
Cited by
-
Human mitochondrial RNA polymerase: evaluation of the single-nucleotide-addition cycle on synthetic RNA/DNA scaffolds.Biochemistry. 2011 Jun 7;50(22):5016-32. doi: 10.1021/bi200350d. Epub 2011 May 12. Biochemistry. 2011. PMID: 21548588 Free PMC article.
-
G-quadruplex structure and stability illuminated by 2-aminopurine phasor plots.Nucleic Acids Res. 2012 May;40(9):4203-15. doi: 10.1093/nar/gkr1286. Epub 2012 Jan 12. Nucleic Acids Res. 2012. PMID: 22241767 Free PMC article.
-
High-throughput Kinetics using capillary Electrophoresis and Robotics (HiKER) platform used to study T7, T3, and Sp6 RNA polymerase misincorporation.PLoS One. 2024 Dec 2;19(12):e0312743. doi: 10.1371/journal.pone.0312743. eCollection 2024. PLoS One. 2024. PMID: 39621686 Free PMC article.
-
Transcriptional fidelities of human mitochondrial POLRMT, yeast mitochondrial Rpo41, and phage T7 single-subunit RNA polymerases.J Biol Chem. 2017 Nov 3;292(44):18145-18160. doi: 10.1074/jbc.M117.797480. Epub 2017 Sep 7. J Biol Chem. 2017. PMID: 28882896 Free PMC article.
-
Structure, mechanism, and regulation of mitochondrial DNA transcription initiation.J Biol Chem. 2020 Dec 25;295(52):18406-18425. doi: 10.1074/jbc.REV120.011202. Epub 2020 Oct 30. J Biol Chem. 2020. PMID: 33127643 Free PMC article. Review.
References
-
- Gralla JD, Carpousis AJ, Stefano JE. Productive and abortive initiation of transcription in vitro at the lac UV5 promoter. Biochemistry. 1980;19:5864–9. - PubMed
-
- Martin CT, Muller DK, Coleman JE. Processivity in early stages of transcription by T7 RNA polymerase. Biochemistry. 1988;27:3966–74. - PubMed
-
- Villemain J, Guajardo R, Sousa R. Role of open complex instability in kinetic promoter selection by bacteriophage T7 RNA polymerase. J Mol Biol. 1997;273:958–77. - PubMed
-
- Jia Y, Patel SS. Kinetic mechanism of transcription initiation by bacteriophage T7 RNA polymerase. Biochemistry. 1997;36:4223–32. - PubMed
-
- Hsu LM. Promoter clearance and escape in prokaryotes. Biochim Biophys Acta. 2002;1577:191–207. - PubMed
Publication types
MeSH terms
Substances
Grants and funding
LinkOut - more resources
Full Text Sources
Other Literature Sources
