Comparative Study
. 2011 Jan 13:172:270-84.
doi: 10.1016/j.neuroscience.2010.10.061. Epub 2010 Oct 28.

Neural heterogeneities influence envelope and temporal coding at the sensory periphery

Affiliations
Comparative Study

Neural heterogeneities influence envelope and temporal coding at the sensory periphery

M Savard et al. Neuroscience. .

Abstract

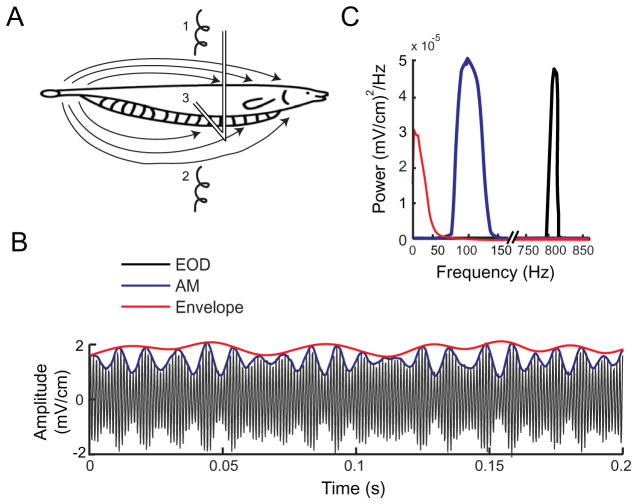
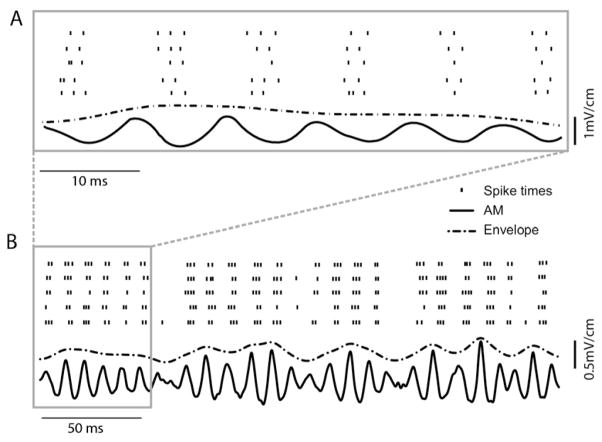
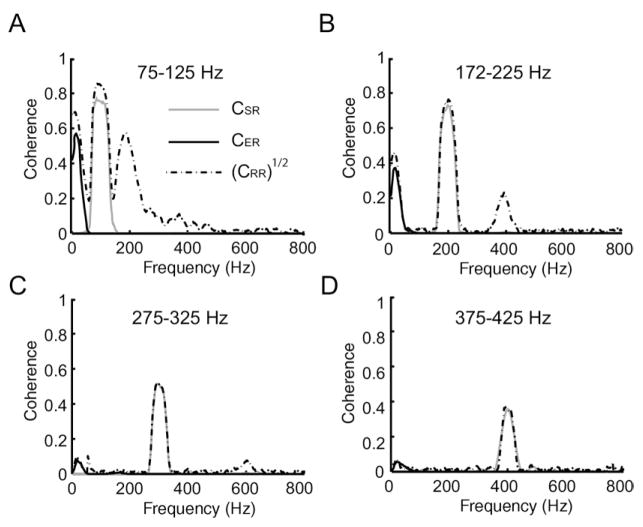
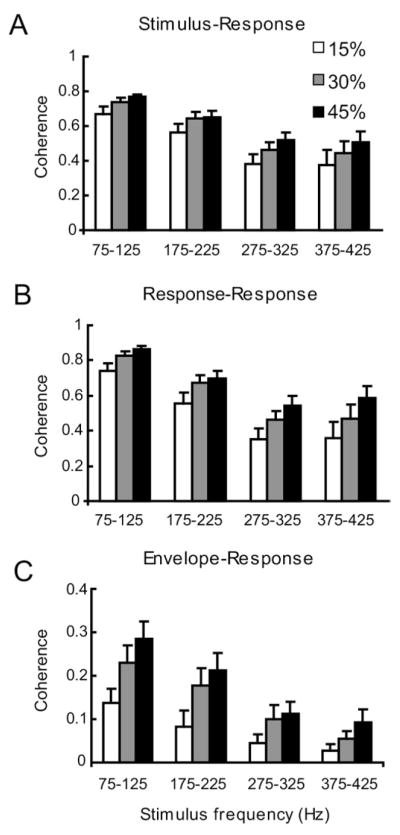
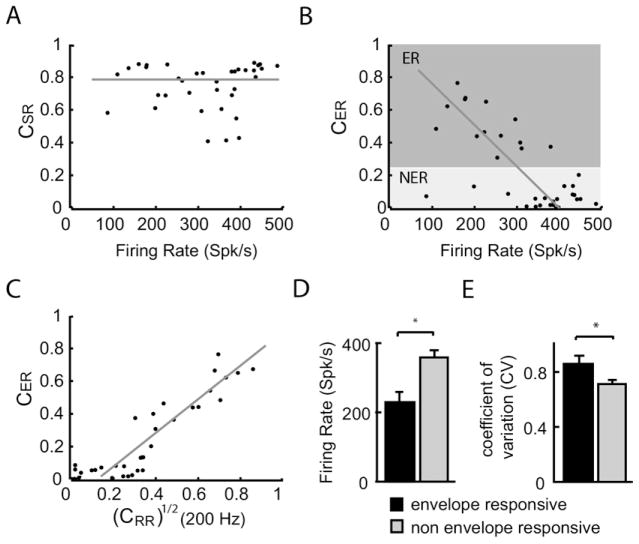
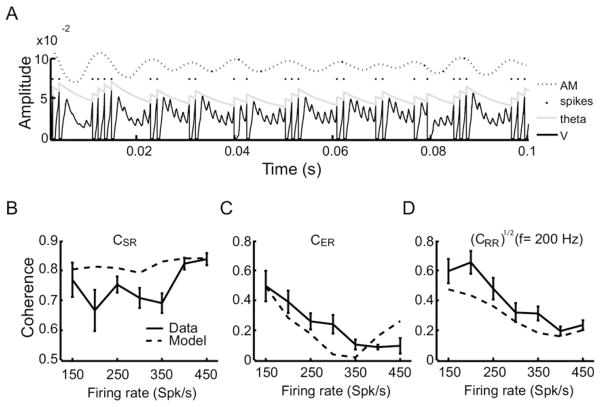
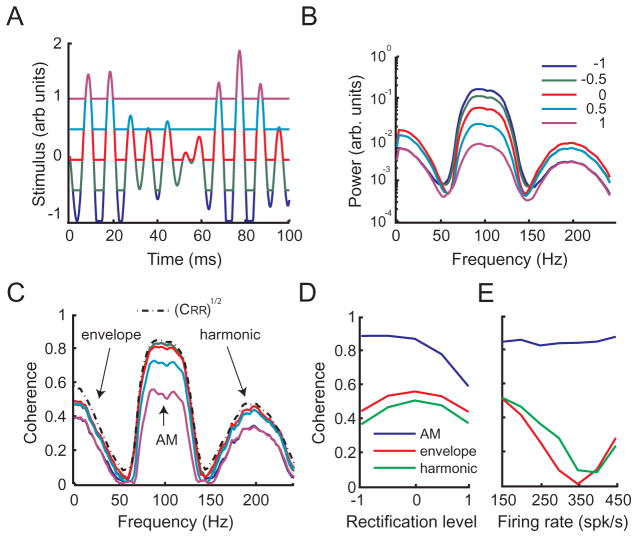
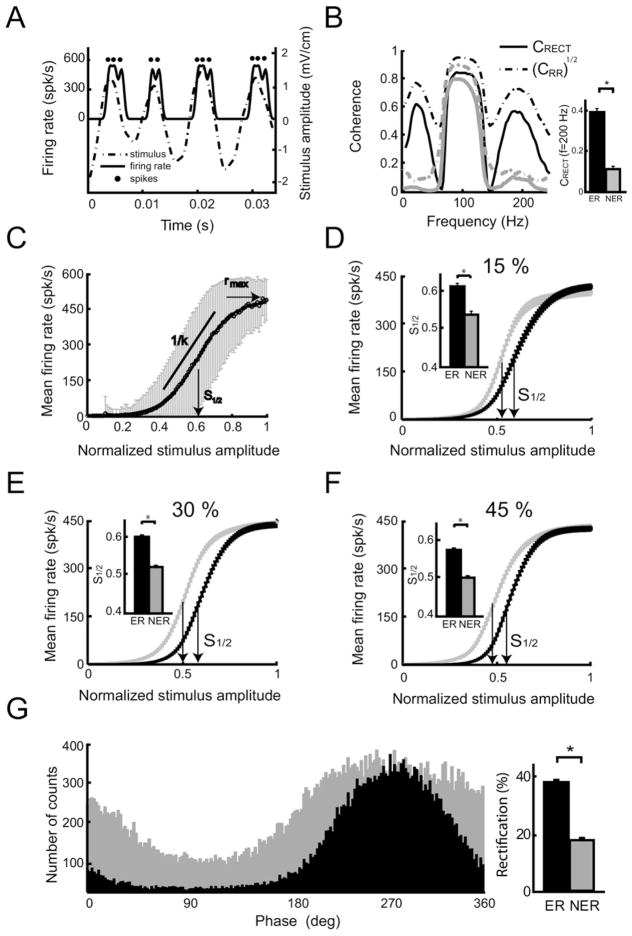
Peripheral sensory neurons respond to stimuli containing a wide range of spatio-temporal frequencies. We investigated electroreceptor neuron coding in the gymnotiform wave-type weakly electric fish Apteronotus leptorhynchus. Previous studies used low to mid temporal frequencies (<256 Hz) and showed that electroreceptor neuron responses to sensory stimuli could be almost exclusively accounted for by linear models, thereby implying a rate code. We instead used temporal frequencies up to 425 Hz, which is in the upper behaviorally relevant range for this species. We show that electroreceptors can: (A) respond up to the highest frequencies tested and (B) display strong nonlinearities in their responses to such stimuli. These nonlinearities were manifested by the fact that the responses to repeated presentations of the same stimulus were coherent at temporal frequencies outside of those contained in the stimulus waveform. Specifically, these consisted of low frequencies corresponding to the time varying contrast or envelope of the stimulus as well as higher harmonics of the frequencies contained in the stimulus. Heterogeneities in the afferent population influenced nonlinear coding as afferents with the lowest baseline firing rates tended to display the strongest nonlinear responses. To understand the link between afferent heterogeneity and nonlinear responsiveness, we used a phenomenological mathematical model of electrosensory afferents. Varying a single parameter in the model was sufficient to account for the variability seen in our experimental data and yielded a prediction: nonlinear responses to the envelope and at higher harmonics are both due to afferents with lower baseline firing rates displaying greater degrees of rectification in their responses. This prediction was verified experimentally as we found that the coherence between the half-wave rectified stimulus and the response resembled the coherence between the responses to repeated presentations of the stimulus in our dataset. This result shows that rectification cannot only give rise to responses to low frequency envelopes but also at frequencies that are higher than those contained in the stimulus. The latter result implies that information is contained in the fine temporal structure of electroreceptor afferent spike trains. Our results show that heterogeneities in peripheral neuronal populations can have dramatic consequences on the nature of the neural code.


Figures

Fig. 1
Fig. 1
Experimental methods. (A) Schematic diagram of the experimental setup. The animal is placed in a water-filled tank and AMs of its own EOD are delivered via stimulating electrodes 1 and 2. We recorded the changes in EOD amplitude through a small dipole (3) positioned 1–2 mm lateral to the animal. (B) Example traces of the signal recorded through the dipole when the AM consisted of 75–125 Hz noise showing the amplitude-modulated EOD (black) and the AM (blue). Also shown in red is the envelope, a non-linear transformation of the AM. (C) Power spectra of the amplitude-modulated EOD (black), AM (blue) and envelope (red) showing the different frequency contents of these signals. For interpretation of the references to color in this figure legend, the reader is referred to the Web version of this article.
Fig. 2
Fig. 2
Electroreceptor afferents respond to the AM itself as well as its envelope. (A) AM waveform (75–125 Hz, 30% contrast, solid black) and raster plot showing the spike times (bars) obtained in response to five repeated presentations of this AM stimulus. The unit fires action potentials for a narrow range of AM phases. The envelope waveform (dashed) is also shown (dashed gray). (B) The responses of this same electroreceptor to the same AM waveform are shown for a larger length of time. This unit displayed increases in firing rate as a function of increases in envelope amplitude. Note that the time scale bar differs between panels (A, B) and that the envelope and AM signals were slightly offset with respect to one another in both panels for display purposes.
Fig. 3
Fig. 3
Quantifying afferent responses to AM stimuli of different frequency content. Coherence curves between the response of the same neuron as in Fig. 2 and the AM CSR(f) (grey), envelope CER(f) (black) as well as the square rooted response-response coherence [CRR(f)]1/2 (dashed). These curves were calculated for 75–125 Hz (A), 175–225 Hz (B), 275–325 Hz (C) and 375–425 Hz (D) AM stimuli and for 30% contrast.
Fig. 4
Fig. 4
Summary of population-averaged afferent responses to AM stimuli of different contrasts (15%, 30%, and 43%) and frequency bandwidths (75–125, 175–225, 275–325, 375–425 Hz). (A) Population-averaged peak values for the stimulus-response coherence CSR(f). (B) Population-averaged peak values for the square rooted response-response coherence [CRR(f)]1/2. (C) Population-averaged peak values for the envelope-response coherence CER(f).
Fig. 5
Fig. 5
Effects of electroreceptor afferent heterogeneities on their responses to AM stimuli. (A) The stimulus-response coherence CSR(f) was independent of the baseline firing rate (i.e. in the absence of an AM). (B) The envelope-response coherence CER(f) was strongly negatively correlated with the baseline firing rate (r=−0.68; P<0.005). (C) The envelope-response coherence CER(f) and the square rooted response-response coherence [CRR(f)]1/2 evaluated at the first harmonic of the mean frequency contained in the stimulus waveform (i.e. f=200 Hz) were positively correlated (r=0.88; P<0.005). (D) Population-averaged baseline firing rates for envelope responsive (ER, black) and for non-envelope responsive (NER, gray) afferents. (E) Population-averaged coefficient of variation (CV) values for envelope responsive (ER, black) and for non-envelope responsive (NER, gray) afferents. * indicates statistical significance at the P = 0.05 levels using a Wilcoxon ranksum test.
Fig. 6
Fig. 6
Modeling linear and nonlinear afferent responses to sensory stimulation. (A) Example membrane potential (V, black), threshold (Θ, gray) and stimulus (AM, dashed) from the model. Spiking occurs when the membrane potential crosses the threshold from below, at which time voltage is reset to zero. Note that we were using 30% contrast. (B) The stimulus-response coherence CSR(f) as a function of the firing rate of the model (dashed) was comparable to that obtained from our experimental data (solid). (C) The envelope-response coherence CER(f) as a function of firing rate decreased with increasing firing rate of the model neuron (dashed) similar to our experimental data (solid). (D) The square rooted response-response coherence [CRR(f)]1/2 evaluated at 200 Hz (i.e. the first harmonic of the mean frequency contained in the stimulus waveform) decreases as a function of increasing firing rate in the model (dashed), which is similar to our experimental data (solid).
Fig. 7
Fig. 7
Rectification as a mechanism for generating nonlinear responses to sensory stimulation. (A) Time series of the AM stimulus waveform with different levels of half wave rectification. The values of the stimulus that were below the rectification threshold were set to the value of the threshold. (B) Power spectra associated with the stimulus rectification in (A). (C) Stimulus response coherence between the model neuron response for 75–125 Hz stimulation and the rectified AM CRECT(f) for different levels of rectification shown in (A). This was obtained for a fixed value of the current Ibias corresponding to a representative firing rate (FR) of 150 Hz. (D) The coherence between the response and the rectified stimulus waveform CRECT(f) was evaluated at frequencies corresponding to the envelope (20 Hz, red), AM (100 Hz, blue) and to the first harmonic (200 Hz, green) as a function of the level of rectification for a fixed value of Ibias=0 corresponding to a mean firing rate of 150 Hz. (E) The coherence between the response and the rectified stimulus waveform was evaluated at frequencies corresponding to the envelope (20 Hz, red), AM (100 Hz, blue) and to the first harmonic (200 Hz, green) as a function of the neuron’s firing rate (which was varied by changing the value of the parameter Ibias in the model between 0 and 0.0315) for a fixed level of rectification of zero. For interpretation of the references to color in this figure legend, the reader is referred to the Web version of this article.
Fig. 8
Fig. 8
Verifying the model’s prediction. (A) Instantaneous firing rate (solid black) and stimulus (dashed) time series from an example afferent. The spike times are also shown (dots). (B) Left: Stimulus-response coherence between the half-wave rectified stimulus and the response CRECT(f) (solid) and the square rooted response-response coherence [CRR(f)]1/2 (dashed), for example, envelope responsive (black) and non-envelope responsive (gray) afferents. Right: Population averages of the coherence between the half-wave rectified stimulus and the response CRECT(f) evaluated at f=200 Hz for envelope responsive (black) and non-envelope responsive (grey) neurons. (C) The average firing rate is plotted against the normalized stimulus amplitude (hollow circles) with the standard error bars (gray) to obtain the input-output function. These data were fitted with a sigmoid function (solid black). Also shown are the sigmoid function’s inflection point S1/2, maximum value rmax., and inverse slope at the inflection point k. (D–F) Population-averaged sigmoid fits for ER and NER afferents show differences in the position of their inflection points S1/2. Insets: S1/2 is larger for ER neurons. These data are shown for 75–125 Hz AM frequency content and for 15%, 30% and 45% contrast, respectively. (G) Left: Phase histograms from an example ER afferent (black) and NER afferent (gray). It is seen that the ER afferent displays greater rectification. Right: Population-averaged values of rectification were larger for ER neurons than for NER neurons. The rectification values were defined as the percent of bins for which the count was less than 30% of the mean bin count.

Similar articles

Cited by

References

    1. Avila-Akerberg O, Krahe R, Chacron MJ. Neural heterogeneities and stimulus properties affect burst coding in vivo. Neuroscience. 2010;168:300–313. - PMC - PubMed
    1. Bastian J. Electrolocation.1. How the electroreceptors of Apteronotus albifrons code for moving objects and other electrical stimuli. J Comp Physiol. 1981a;144:465–479.
    1. Bastian J. Electrolocation.2. The Effects of moving objects and other electrical stimuli on the activities of 2 categories of posterior lateral line lobe cells in Apteronotus albifrons. J Comp Physiol. 1981b;144:481–494.
    1. Bastian J. Plasticity in an electrosensory system. I. General features of a dynamic sensory filter. J Neurophysiol. 1996a;76:2483–2496. - PubMed
    1. Bastian J. Plasticity in an electrosensory system. II. Postsynaptic events associated with a dynamic sensory filter. J Neurophysiol. 1996b;76:2497–2507. - PubMed

Publication types

MeSH terms