. 2011 Feb 14;54(4):2659-71.
doi: 10.1016/j.neuroimage.2010.10.050. Epub 2010 Oct 28.

Thickness of the human cerebral cortex is associated with metrics of cerebrovascular health in a normative sample of community dwelling older adults

Affiliations

Thickness of the human cerebral cortex is associated with metrics of cerebrovascular health in a normative sample of community dwelling older adults

Elizabeth C Leritz et al. Neuroimage. .

Abstract

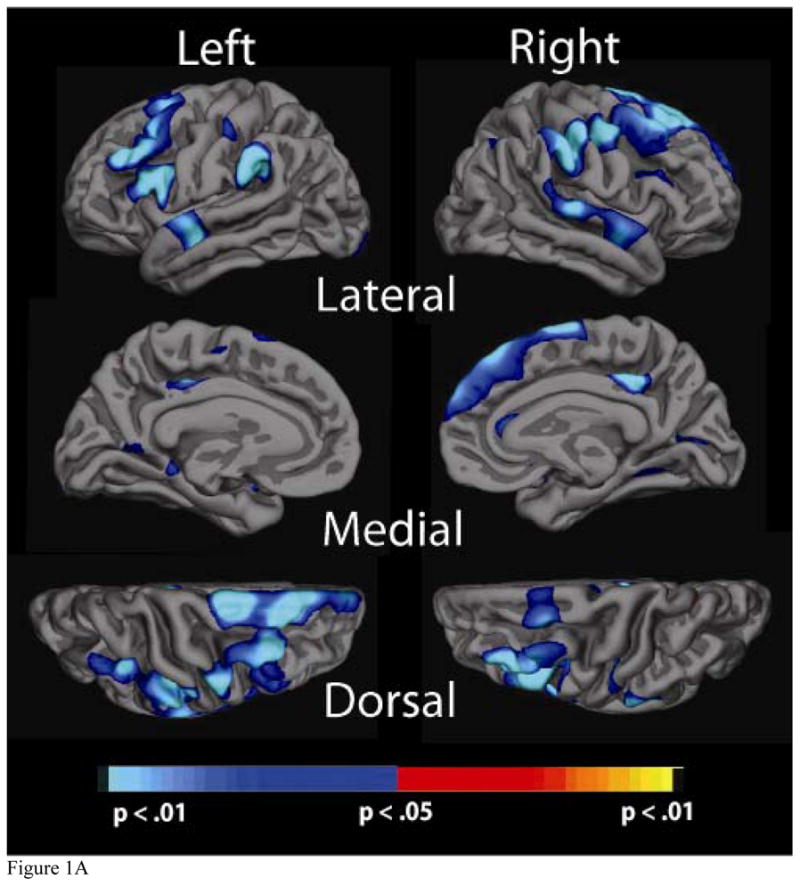
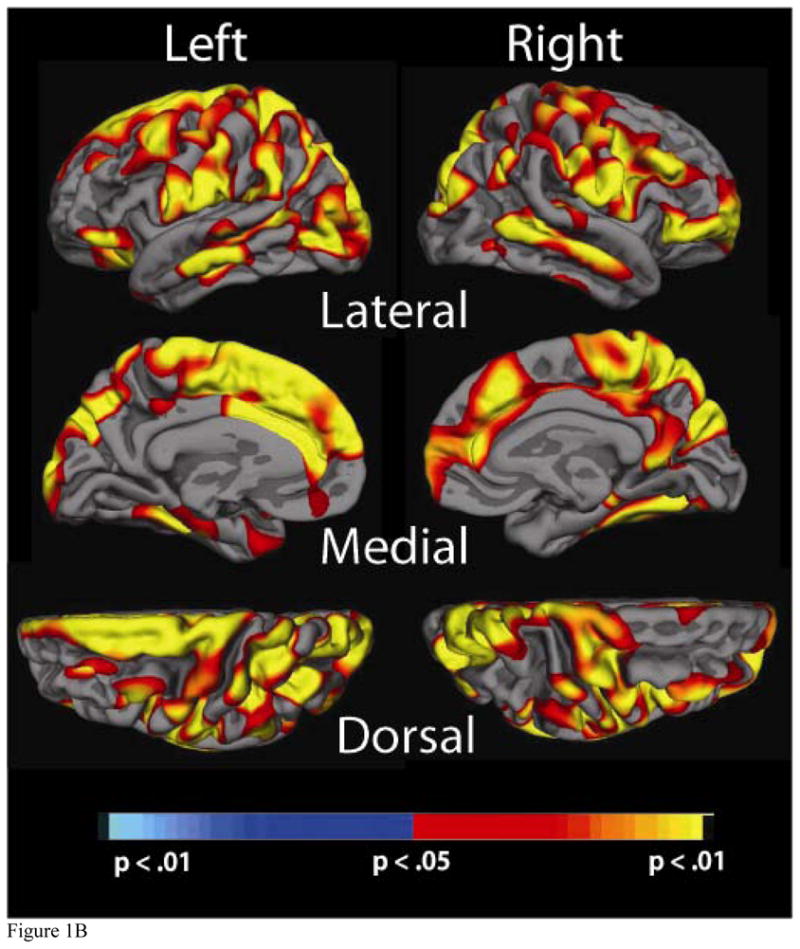
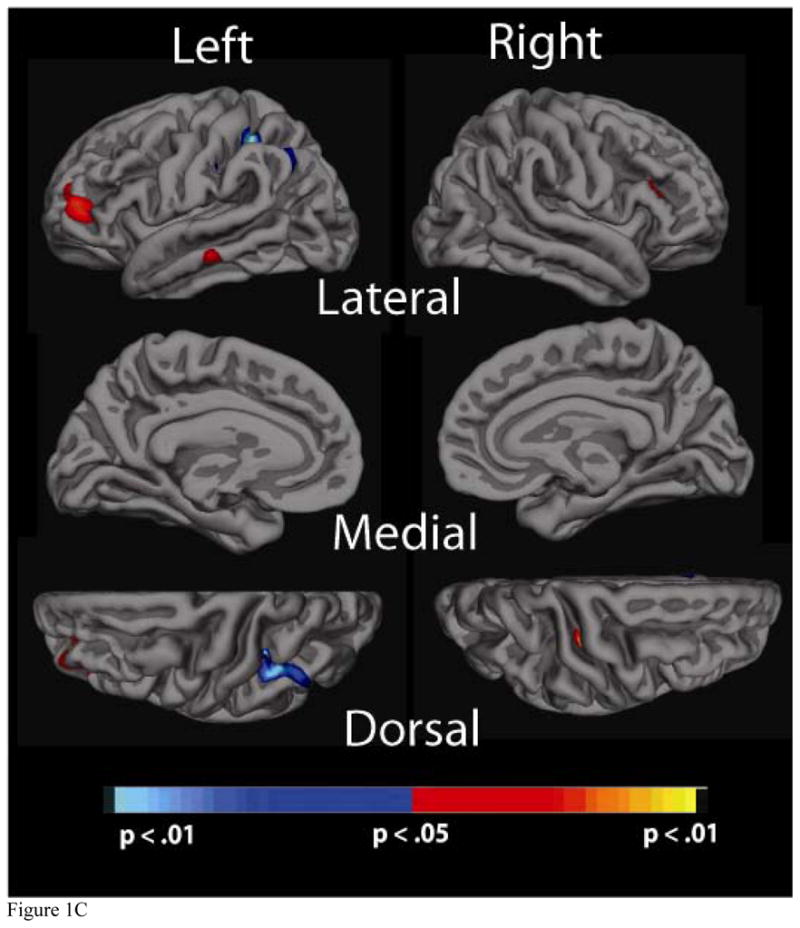
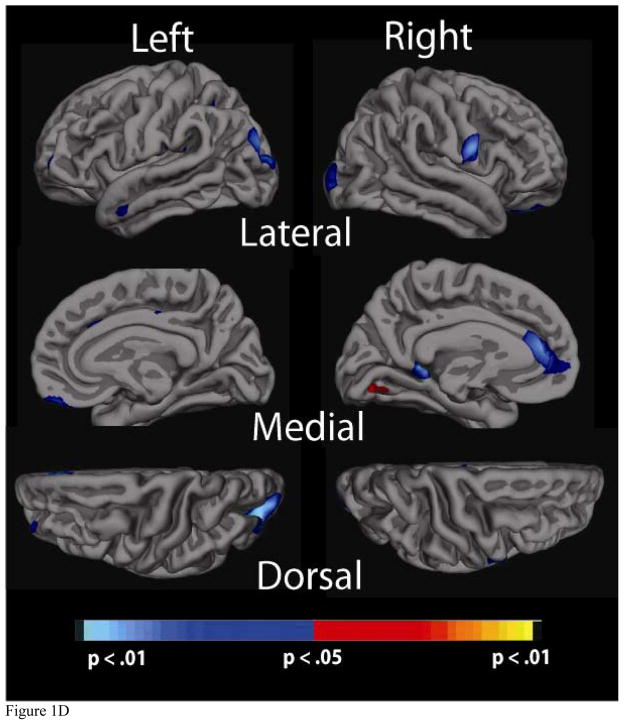
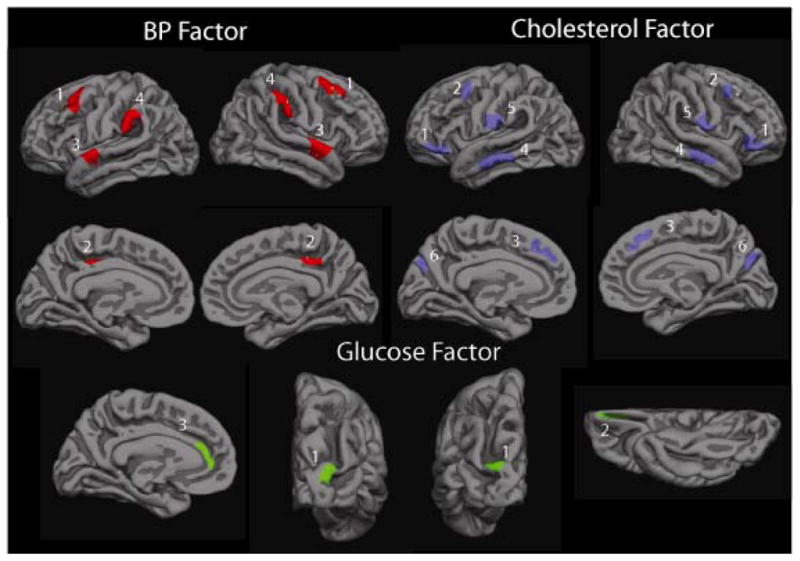
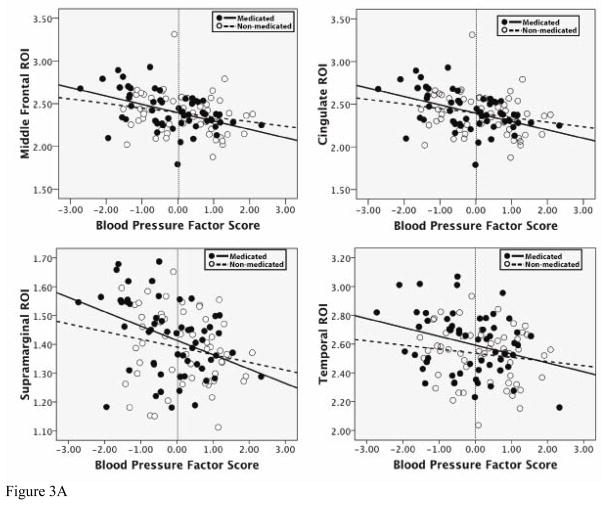
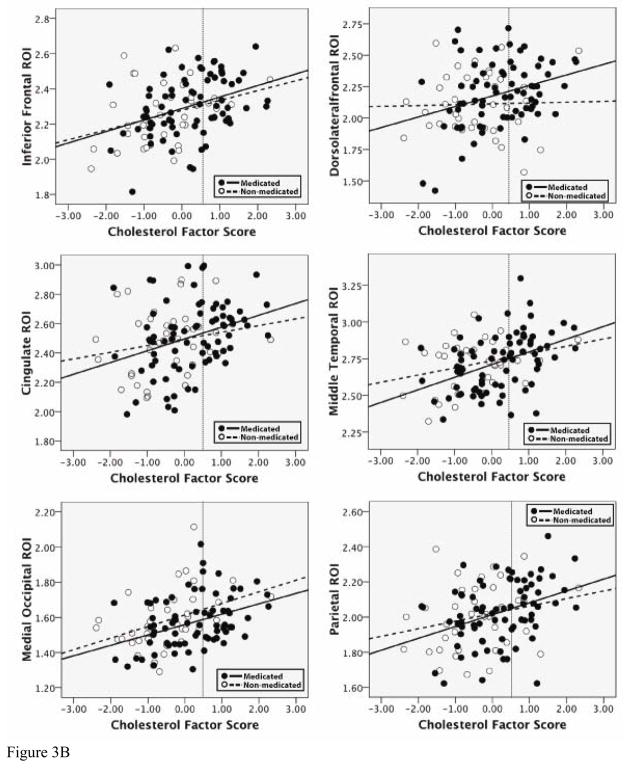
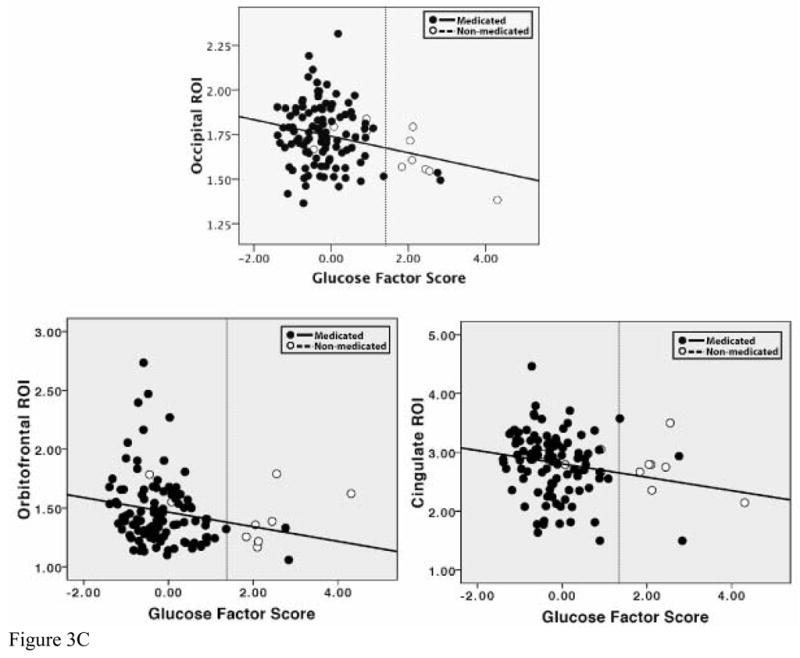
We examined how wide ranges in levels of risk factors for cerebrovascular disease are associated with thickness of the human cerebral cortex in 115 individuals ages 43-83 with no cerebrovascular or neurologic history. Cerebrovascular risk factors included blood pressure, cholesterol, body mass index, creatinine, and diabetes-related factors. Variables were submitted into a principal components analysis that confirmed four orthogonal factors (blood pressure, cholesterol, cholesterol/metabolic and glucose). T1-weighted MRI was used to create models of the cortex for calculation of regional cortical thickness. Increasing blood pressure factor scores were associated with numerous regions of reduced thickness. Increasing glucose scores were modestly associated with areas of regionally decreased thickness. Increasing cholesterol scores, in contrast, were associated with thicker cortex across the whole brain. All findings were primarily independent of age. These results provide evidence that normal and moderately abnormal levels of parameters used to assess cerebrovascular health may impact brain structure, even in the absence of cerebrovascular disease. Our data have important implications for the clinical management of vascular health, as well as for what is currently conceptualized as "normal aging" as they suggest that subclinical levels of risk may impact cortical gray matter before a disease process is evident.


Figures

Figure 1
Figure 1
Significance maps of the relationship between cortical thickness and physiological factor scores for the a) Blood Pressure, b) Cholesterol, c) Cholesterol/Metabolic and d) Glucose factors. Maps are presented on the inflated cortical surface of an average brain with dark grey regions representing sulci and light gray regions representing gyri. The colorscale at the bottom of each map represents the significance of the thickness changes with yellow and light blue indicating the most significant regions; blue indicates a negative association between physiological factor score and thickness, yellow/red indicates a positive association.
Figure 1
Figure 1
Significance maps of the relationship between cortical thickness and physiological factor scores for the a) Blood Pressure, b) Cholesterol, c) Cholesterol/Metabolic and d) Glucose factors. Maps are presented on the inflated cortical surface of an average brain with dark grey regions representing sulci and light gray regions representing gyri. The colorscale at the bottom of each map represents the significance of the thickness changes with yellow and light blue indicating the most significant regions; blue indicates a negative association between physiological factor score and thickness, yellow/red indicates a positive association.
Figure 2
Figure 2
ROIs for Blood Pressure, Cholesterol, and Glucose factor scores. Blood Pressure factor. 1: Middle Frontal, 2: Cingulate, 3: Supramarginal, 4: Temporal. Cholesterol factor. 1: Inferior Frontal, 2: Lateral Frontal, 3: Cingulate, 4: Temporal, 5: Parietal, 6: Occipital. Glucose factor. 1: Occipital, 2. Orbitofrontal (right hemisphere only), 3. Cingulate (left hemisphere only).
Figure 3
Figure 3
Scatterplots of the relationship between factors scores and cortical thickness in ROIs. In each graph, a dotted line has been placed to indicate the clinical cutoff for mild elevations of blood pressure, cholesterol, or glucose, demonstrating the fact that a large portion of our sample falls below this classification. a. Relationship of BP factor scores to thickness in selected ROIs for medicated and non-medicated groups. In all ROIs, there was a main effect of BP factor score, but not of medication use, and there were no significant interactions between BP factor score and medication use. b. Relationship of Cholesterol factor scores to thickness in selected ROIs for medicated and non-medicated groups. In all ROIs, there was a main effect of Cholesterol factor score, but not of medication use, and there were no significant interactions between Cholesterol factor score and medication use. c. Relationship of Glucose factor scores to thickness in selected ROIs for medicated and non-medicated groups. Note: formal regression analyses were not conducted with these ROIs
Figure 3
Figure 3
Scatterplots of the relationship between factors scores and cortical thickness in ROIs. In each graph, a dotted line has been placed to indicate the clinical cutoff for mild elevations of blood pressure, cholesterol, or glucose, demonstrating the fact that a large portion of our sample falls below this classification. a. Relationship of BP factor scores to thickness in selected ROIs for medicated and non-medicated groups. In all ROIs, there was a main effect of BP factor score, but not of medication use, and there were no significant interactions between BP factor score and medication use. b. Relationship of Cholesterol factor scores to thickness in selected ROIs for medicated and non-medicated groups. In all ROIs, there was a main effect of Cholesterol factor score, but not of medication use, and there were no significant interactions between Cholesterol factor score and medication use. c. Relationship of Glucose factor scores to thickness in selected ROIs for medicated and non-medicated groups. Note: formal regression analyses were not conducted with these ROIs

References

    1. 2009 a. American Diabetes Association.

    1. 2009 b. American Heart Association.

    1. Bohnstedt M, Fox PJ, Kohatsu ND. Correlates of Mini-Mental Status Examination scores among elderly demented patients: the influence of race-ethnicity. J Clin Epidemiol. 1994;47:1381–1387. - PubMed
    1. Brands AM, Kessels RP, Hoogma RP, Henselmans JM, van der Beek Boter JW, Kappelle LJ, de Haan EH, Biessels GJ. Cognitive performance, psychological well-being, and brain magnetic resonance imaging in older patients with type 1 diabetes. Diabetes. 2006;55:1800–1806. - PubMed
    1. Brookmeyer R, Ziegler-Graham K, Johnson E, Arrighi HM. Forecasting the global burden of Alzheimer’s disease. Johns Hopkins University Department of Biostatics working Papers. 2007;130 in press. - PubMed

Publication types