. 2010 Nov 3;12(5):443-55.
doi: 10.1016/j.cmet.2010.09.012.

Global epigenomic analysis of primary human pancreatic islets provides insights into type 2 diabetes susceptibility loci

Affiliations

Global epigenomic analysis of primary human pancreatic islets provides insights into type 2 diabetes susceptibility loci

Michael L Stitzel et al. Cell Metab. .

Erratum in

  • Cell Metab. 2010 Dec 1;12(6):683

Abstract

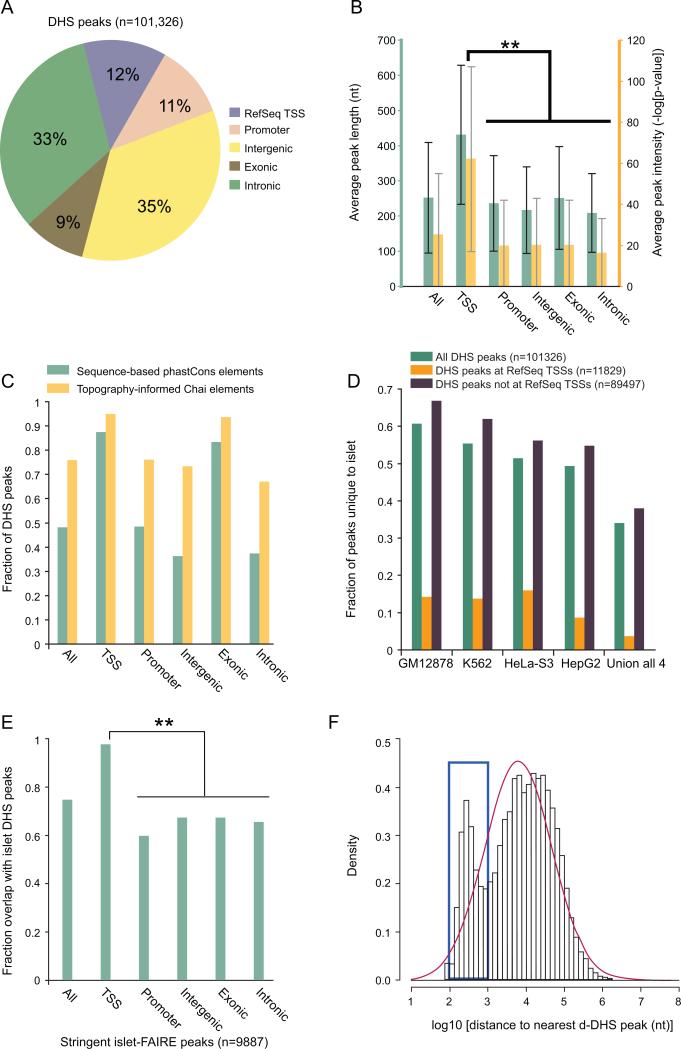
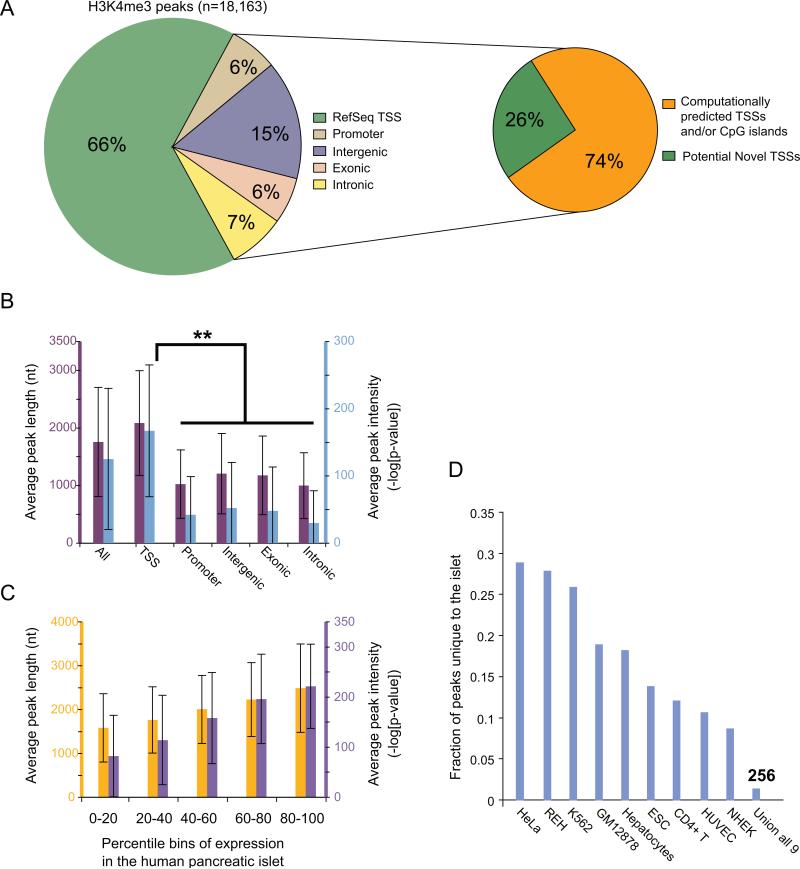
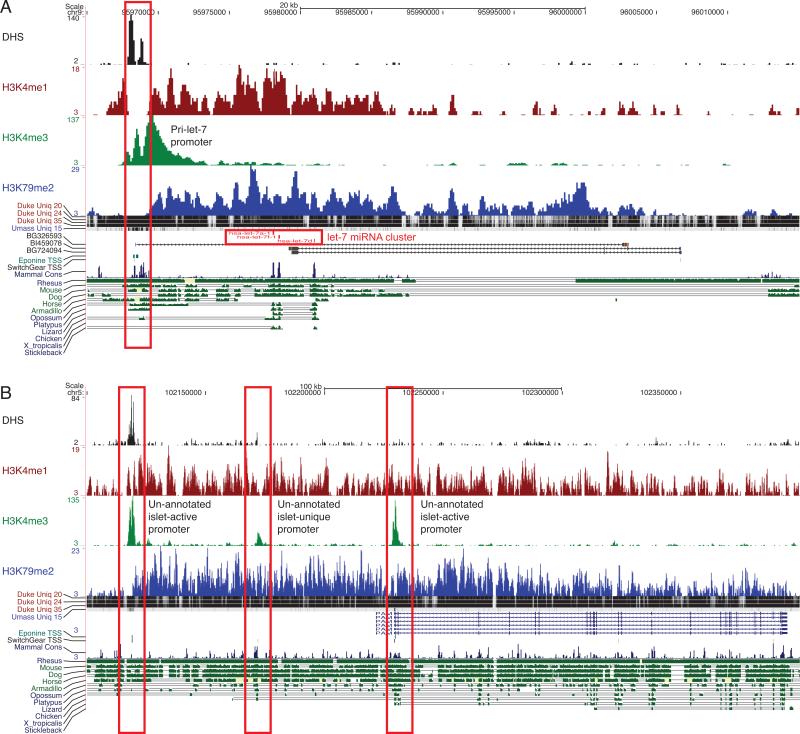
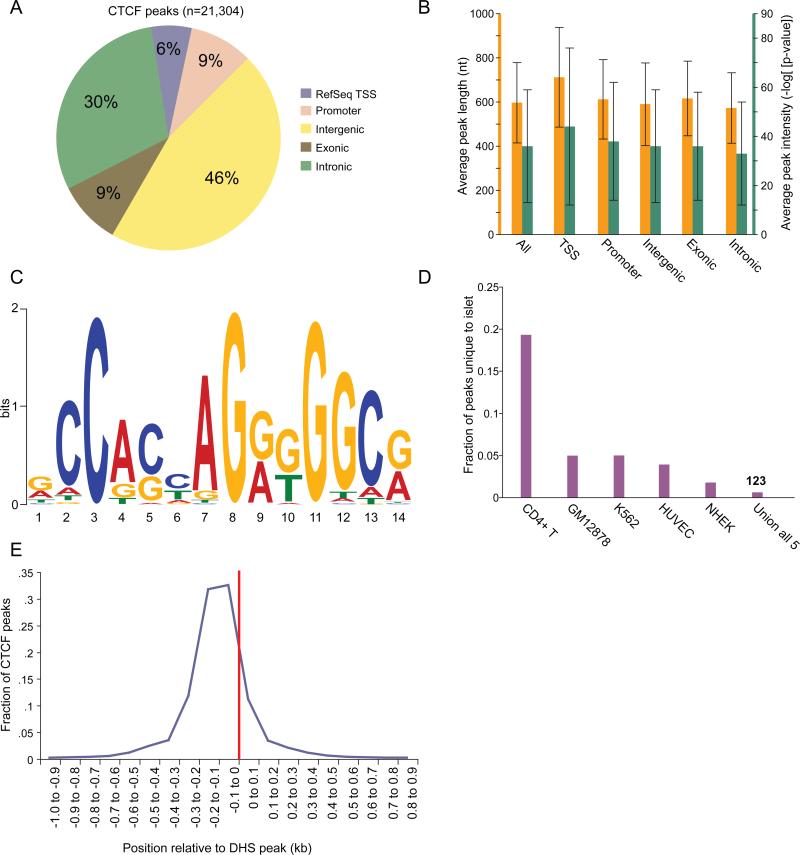
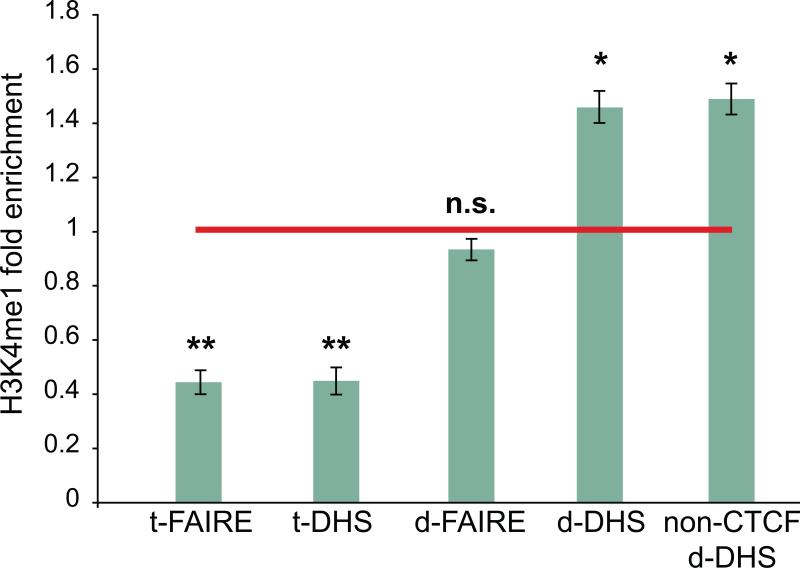
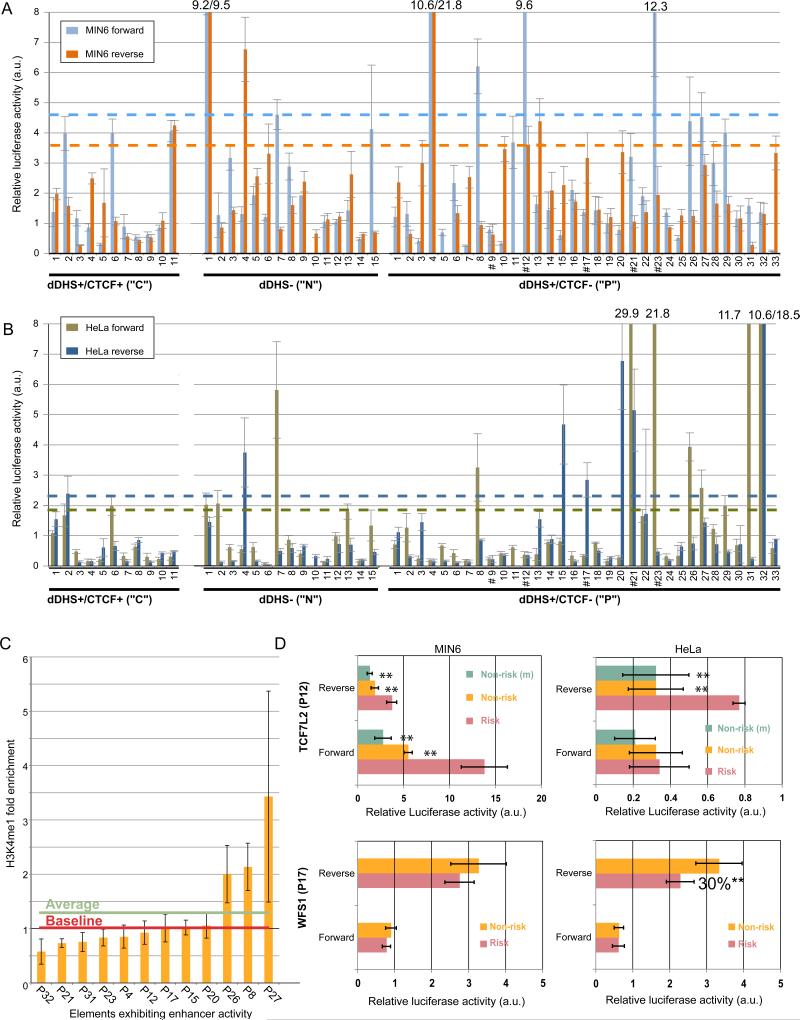
Identifying cis-regulatory elements is important to understanding how human pancreatic islets modulate gene expression in physiologic or pathophysiologic (e.g., diabetic) conditions. We conducted genome-wide analysis of DNase I hypersensitive sites, histone H3 lysine methylation modifications (K4me1, K4me3, K79me2), and CCCTC factor (CTCF) binding in human islets. This identified ∼18,000 putative promoters (several hundred unannotated and islet-active). Surprisingly, active promoter modifications were absent at genes encoding islet-specific hormones, suggesting a distinct regulatory mechanism. Of 34,039 distal (nonpromoter) regulatory elements, 47% are islet unique and 22% are CTCF bound. In the 18 type 2 diabetes (T2D)-associated loci, we identified 118 putative regulatory elements and confirmed enhancer activity for 12 of 33 tested. Among six regulatory elements harboring T2D-associated variants, two exhibit significant allele-specific differences in activity. These findings present a global snapshot of the human islet epigenome and should provide functional context for noncoding variants emerging from genetic studies of T2D and other islet disorders.


Figures

Figure 1
Figure 1. Analysis of DNase I hypersensitive sites in the islet genome
(A) Distribution of DNase I hypersensitive (DHS) peaks across five genomic annotation sets. “Promoter” denotes proximal regions 5kb upstream of RefSeq transcription start sites (TSSs) that do not overlap the TSS. “Exonic” represents regions that overlap at least 1 base with an exon. (B) Average length (teal) and intensity (yellow) of DHS peaks across five genomic annotation sets. Peaks at RefSeq transcription start sites (TSSs) are significantly longer and more intense than those elsewhere (** two-tailed paired Student's t-test p-value < 10-100). Error bars represent s.d. (s.d. measurements were often greater than the sample average due to highly skewed distributions, but error bars were cut off at zero for visualization). (C) Sequence and structure constraint at DHS. DHS peaks at RefSeq TSSs are under substantially greater sequence constraint (assessed by phastCons vertebrate conservation scores) than intronic and intergenic DHS peaks. A large majority of DHS peaks within all genomic annotation sets are under strong structural constraint (assessed by the Chai algorithm (Parker et al., 2009)). (D) Comparison of islet DHS peaks with peaks from 4 different human cell lines. Each data point represents the fraction of total peaks (n=101,326) unique to the human islet relative to each of the other 4 human cell types or all of them combined (Union of all 4). Roughly 35% are unique to the islet and 99% of these are not located at RefSeq TSSs. Varying levels of similarity across cell types may be at least partially explained by differences in the stage of cellular differentiation and/or sequencing depth. (E) Overlap between DHS peaks and Formaldehyde-Assisted-Isolation-of-Regulatory-Elements (FAIRE) peaks. The overlap is significantly greater at RefSeq TSSs than elsewhere (**Fisher's exact test < 10-100). (F) Logarithm-based distribution of the distance to the nearest distal DHS (d-DHS) peak among all d-DHS peaks. The blue box indicates an increased representation of peaks in the ~100-1000 bp range (clustered) relative to Gaussian expectation (red curve). This range is significantly enriched for islet-unique peaks (Fisher's exact test p=2.7 × 10⁻⁹). Comparison of d-DHS, FAIRE, and GLITR locations is found in Figure S1.
Figure 2
Figure 2. Analysis of histone 3 Lysine 4 tri-methylation (H3K4me3) loci in the islet genome
(A) Distribution of H3K4me3 peaks across five genomic annotation sets as described in Figure 1A. 2/3 of the peaks span RefSeq transcription start sites (TSSs: left pie chart). Non-RefSeq H3K4me3 peaks are enriched for computationally predicted TSS and/or CpG islands (right pie chart). Additional information is provided in Figure S3. (B) Average length (purple) and intensity (blue) of H3K4me3 peaks across five genomic annotation sets as described in Figure 1B. The average length and intensity of peaks is significantly higher at TSSs (** two-tailed paired Student's t-test p-value < 10-100). Error bars represent s.d. (C) Relationship between average H3K4me3 peak length (yellow)/intensity (purple) and average gene expression level. Error bars represent s.d. (D) Comparison of islet H3K4me3 peaks with peaks from 9 different human cell types. Each data point represents the fraction of total peaks (n=18,163) unique to the human islet relative to each of the other 9 human cell types or all of them combined (Union all 9). ~1.5% of the peaks are unique to the islet. Varying levels of similarity across cell types may be at least partially explained by differences in the stage of cellular differentiation and/or sequencing depth.
Figure 3
Figure 3. Identifying unannotated islet-active transcription start sites (TSSs)
(A) Candidate islet-active TSS for the primary transcript of the ubiquitous let-7a-1/7d/7f-1 microRNA cluster. The TSS (red box; DHS+, H3K4me3+, H3K4me1-) is ~10kb upstream of the 5’-most microRNA in the cluster, and the full-length primary transcript (H3K79me2+) of ~35kb matches a known EST (BSG326593). This EST likely represents a non-coding RNA primary transcript from which the let-7 cluster of miRNAs are processed (Marson et al., 2008). The strategy for predicting TSSs is shown in Figure S3A. (B) Two candidate islet-active alternative TSSs (red boxes) for the gene PAM, which encodes an islet secretory granule membrane protein. One of the candidate TSSs is also islet-unique and occurs between the annotated TSS and an un-annotated islet-active TSS. Examples of confounding factors for predicting islet-active TSSs are shown in Figure S4.
Figure 4
Figure 4. Profiling of binding sites for the CCCTC-binding factor (CTCF)
(A) Distribution of CTCF peaks across five genomic annotation sets as described in Figure 1A. (B) Average length (orange) and intensity (green) of CTCF peaks across five genomic annotation sets is fairly uniform. Error bars represent s.d. (C) Motif determined by MEME (Bailey and Elkan, 1994) using the top 10% of CTCF peaks. (D) Comparison of islet CTCF peaks with peaks from 5 different cell types. Each data point represents the fraction of total peaks (n=21,304) unique to the human islet relative to each of the other 5 human cell types or all of them combined (Union of all 5). Less than 1% of the peaks are unique to the islet (n=123). Varying levels of similarity across cell types may be at least partially explained by differences in the stage of cellular differentiation and/or sequencing depth. (E) Positioning of CTCF peaks relative to the center of overlapping DHS peaks (red line). Almost all CTCF peaks that overlap DHS peaks are within 200 bp of the DHS peak center.
Figure 5
Figure 5. Representation analysis of histone H3 lysine 4 monomethylation in candidate regulatory regions
DNase I hypersensitive site (DHS) and Formaldehyde Assisted Isolation of Regulatory Element (FAIRE) peaks at RefSeq TSSs (t-DHS and t-FAIRE, respective) are significantly depleted for H3K4me1 signal (** two-tailed paired Student's t-test p-value < 0.005) and DHS peaks at distal, candidate regulatory elements (d-DHS) are enriched for H3K4me1 signal (* two-tailed paired Student's t-test p-value < 0.01). Error bars represent s.d. among three islet samples. FAIRE data was obtained from Gaulton et al. (2010). Representation analysis of additional histone modifications is shown in Figure S5.
Figure 6
Figure 6. Luciferase reporter activity validates putative enhancer elements
(A) Relative luciferase activity of constructs in 3 element classes tested in MIN6 cells. Genomic locations of elements are found in Table S13. Blue and orange dashed lines indicate 2.33 standard deviations (p=0.01) (Heintzman et al., 2009) above the median activity of tested CTCF-bound regions for elements cloned in the forward or reverse orientations, respectively. Data represent the mean ± s.d. of 3 replicates each for 2 separate clones (6 total measurements). C=d-DHS+/CTCF+ element. N=d-DHS-/CTCF-. P=d-DHS+/CTCF- element. # marks elements containing T2D-associated SNPs. Numbers above the bars indicate the luciferase activity for elements beyond the scale of the y axis; a.u. denotes arbitrary units. (B) Relative luciferase activity of constructs in 3 element classes tested in HeLa cells. Data are analyzed and annotated as in (A); a.u.=arbitrary units. (C) H3K4me1 representation in the 12 elements exhibiting enhancer activity. Though the overall average enrichment of H3K4me1 is ~1.3 fold (green line), only 3/12 elements are above baseline (red line). Error bars represent s.d. among three islet samples. (D) Relative luciferase activity of TCF7L2 (P12) and WFS1 (P17) elements in MIN6 (left panels) or HeLa (right panels) cells containing the risk or non-risk alleles of T2D-associated SNPs. For TCF7L2, (m) denotes a mutation generated by site-directed mutagenesis from the risk to non-risk allele. Data represent the mean ± s.d. of 3 replicates each from at least 2 independent clones. **= 2-tailed unpaired Student's t-test p<0.01 a.u.=arbitrary units. Additional allelic analysis is shown in Figure S6.

References

    1. ENCODE Consortium Identification and analysis of functional elements in 1% of the human genome by the ENCODE pilot project. Nature. 2007;447:799–816. - PMC - PubMed
    1. Bailey TL, Elkan C. Fitting a mixture model by expectation maximization to discover motifs in biopolymers. Proc Int Conf Intell Syst Mol Biol. 1994;2:28–36. - PubMed
    1. Barrett JC, Clayton DG, Concannon P, Akolkar B, Cooper JD, Erlich HA, Julier C, Morahan G, Nerup J, Nierras C, et al. Genome-wide association study and meta-analysis find that over 40 loci affect risk of type 1 diabetes. Nat Genet. 2009 - PMC - PubMed
    1. Barski A, Cuddapah S, Cui K, Roh TY, Schones DE, Wang Z, Wei G, Chepelev I, Zhao K. High-resolution profiling of histone methylations in the human genome. Cell. 2007;129:823–837. - PubMed
    1. Barski A, Jothi R, Cuddapah S, Cui K, Roh TY, Schones DE, Zhao K. Chromatin poises miRNA- and protein-coding genes for expression. Genome Res. 2009;19:1742–1751. - PMC - PubMed

Publication types

Associated data