. 2010 Nov 3;12(5):509-20.
doi: 10.1016/j.cmet.2010.10.005.

PER2 controls lipid metabolism by direct regulation of PPARγ

Affiliations

PER2 controls lipid metabolism by direct regulation of PPARγ

Benedetto Grimaldi et al. Cell Metab. .

Abstract

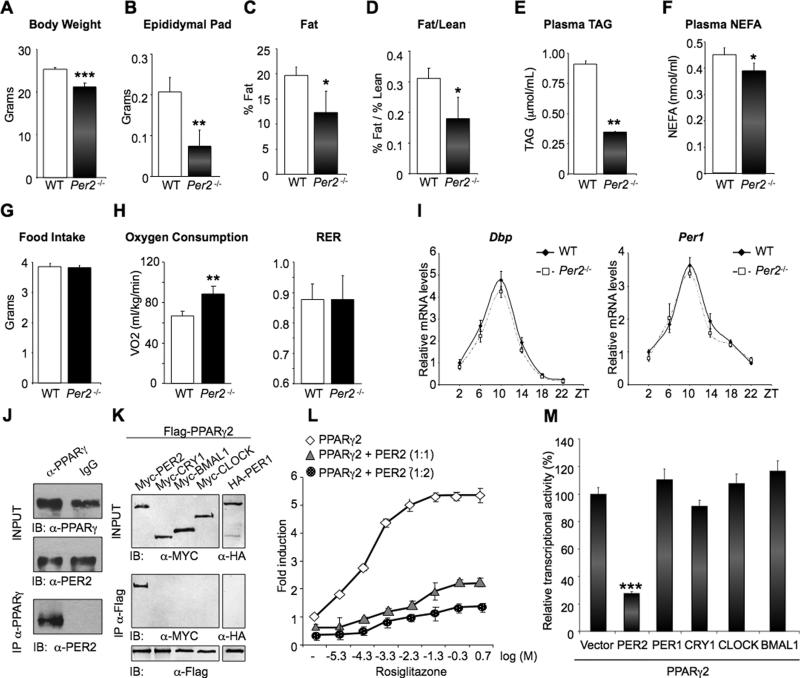
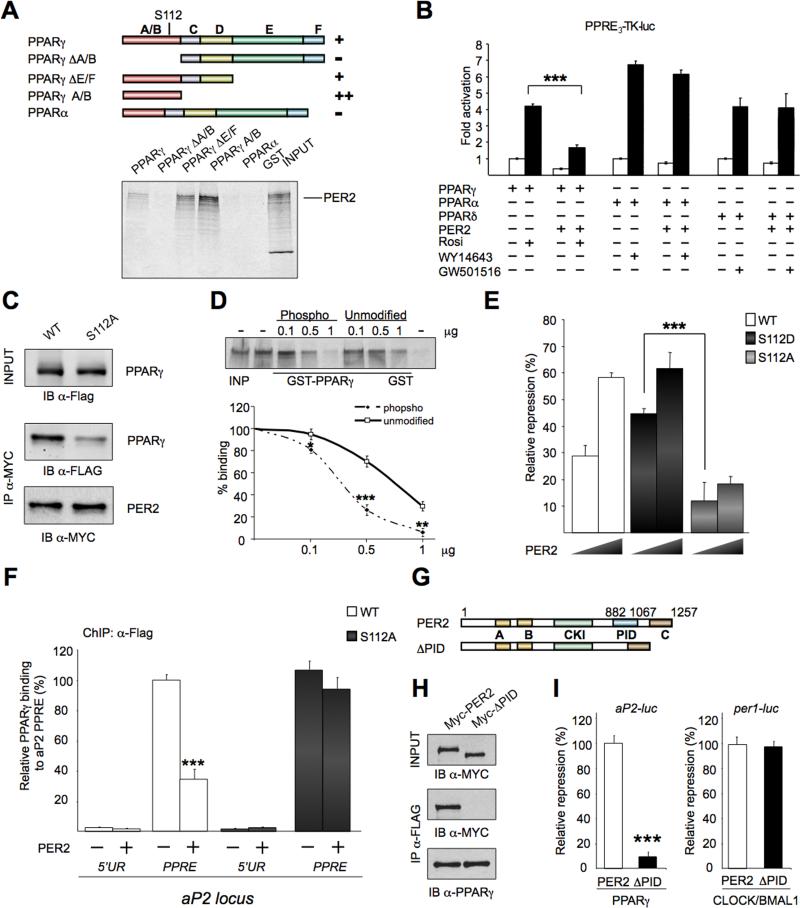
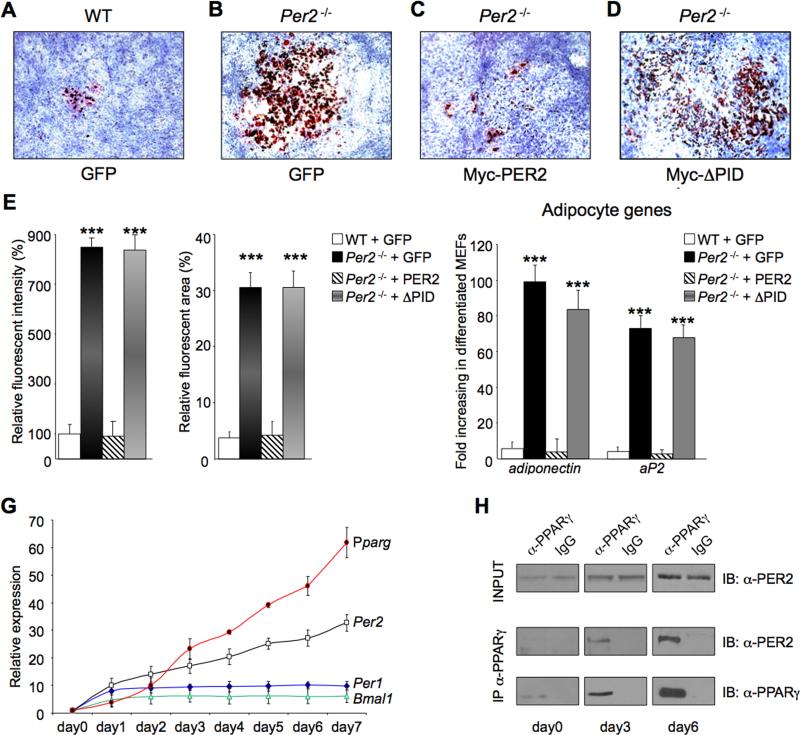
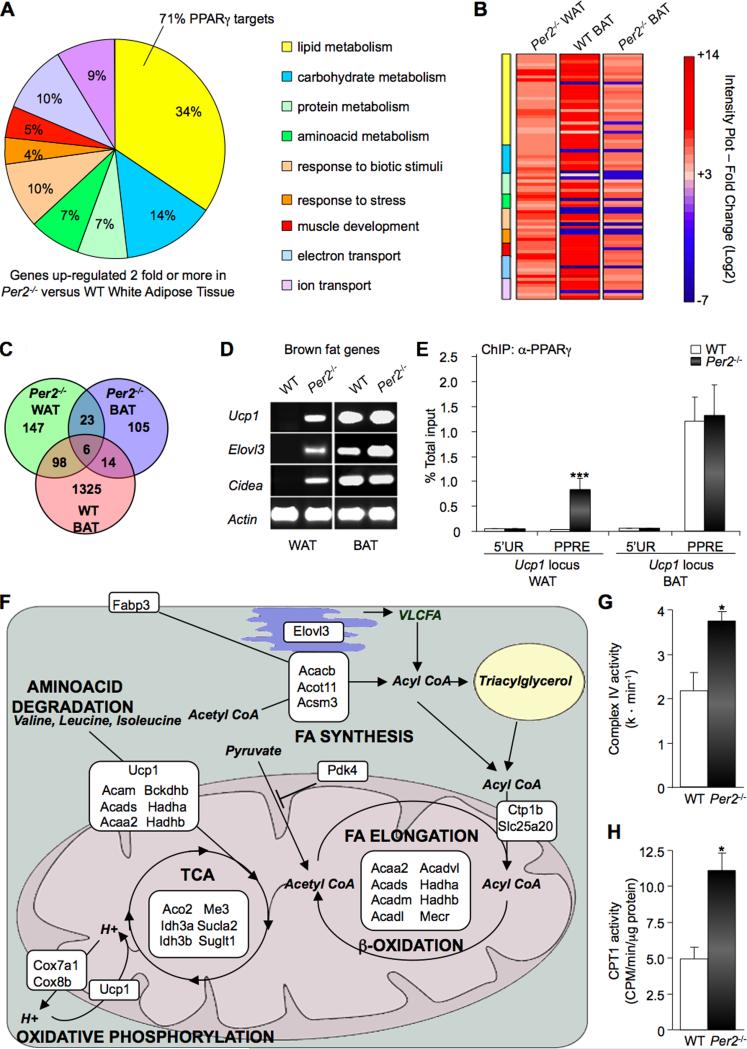
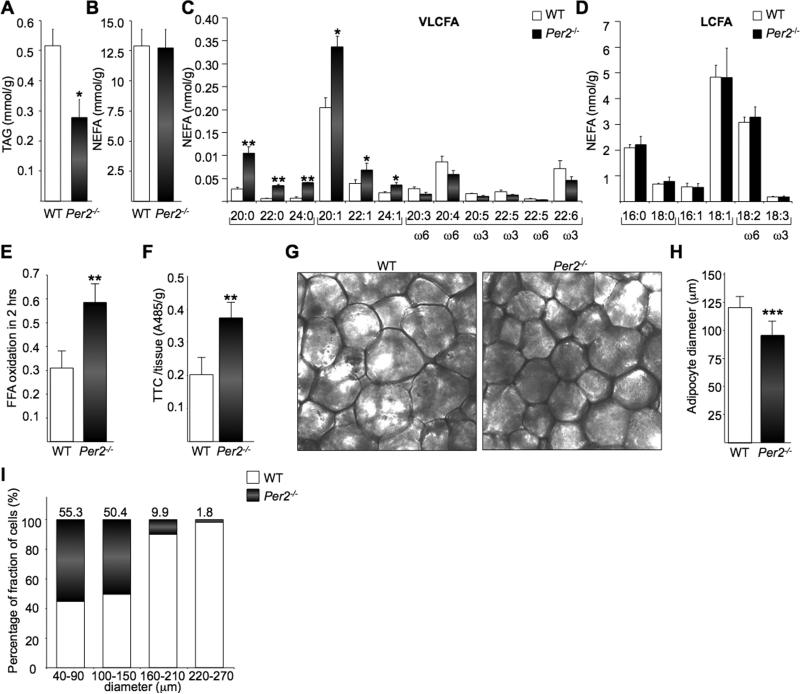
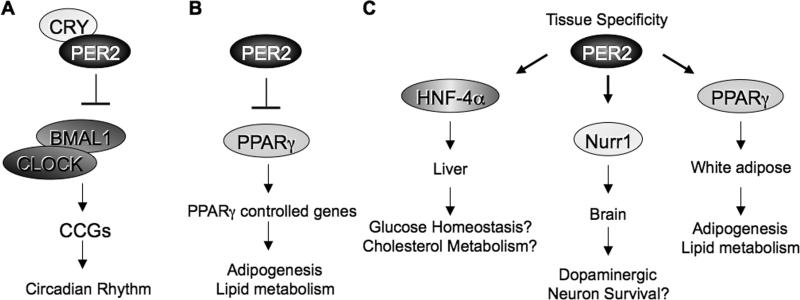
Accumulating evidence highlights intriguing interplays between circadian and metabolic pathways. We show that PER2 directly and specifically represses PPARγ, a nuclear receptor critical in adipogenesis, insulin sensitivity, and inflammatory response. PER2-deficient mice display altered lipid metabolism with drastic reduction of total triacylglycerol and nonesterified fatty acids. PER2 exerts its inhibitory function by blocking PPARγ recruitment to target promoters and thereby transcriptional activation. Whole-genome microarray profiling demonstrates that PER2 dictates the specificity of PPARγ transcriptional activity. Indeed, lack of PER2 results in enhanced adipocyte differentiation of cultured fibroblasts. PER2 targets S112 in PPARγ, a residue whose mutation has been associated with altered lipid metabolism. Lipidomic profiling demonstrates that PER2 is necessary for normal lipid metabolism in white adipocyte tissue. Our findings support a scenario in which PER2 controls the proadipogenic activity of PPARγ by operating as its natural modulator, thereby revealing potential avenues of pharmacological and therapeutic intervention.


Figures

Fig 1
Fig 1. Specific interaction and repression of PER2 on PPARγ
(A) and (B) body and epididymal pad weight of Per2-/- and WT mice. (**P<0.01 and ***P<0.001). (C) and (D) body composition of fat (C) and fat/lean ratio (D) analyzed by MRI (*P<0.05). (E) and (F) Triglyceride (TAG) and non-esterified fatty acid (NEFA) in Per2–/– and WT plasma samples. (*P<0.05 and **P<0.01). (G) Food pellet grams consumed per day. (H) Oxygen consumption and Respiratory Exchange Ratio (RER) of animals monitored for 48 hrs on normal diet. (**P<0.01). (I) qRT-PCR analysis of Dbp and Per1 in WAT at the indicated Zeitgeber Time (ZT). (J) PPARγ was immunoprecipitated from mouse WAT. Total lysates (INPUT) and IP samples were analyzed by IB with PER2 antibody. (K) Flag-PPARγ was immunoprecipitated from JEG-3 cells co-transfected with the indicated tagged CLOCK proteins. Total lysates (INPUT) and IP samples were analyzed by IB with the indicated antibodies. (L) Effect of different concentrations of rosiglitazone (expressed as Log [μM]) on a PPAR-driven reporter (PPRE3-TK-luc) in the presence of 50 ng PPARγ (diamonds) or 50 ng PPARγ and 50 ng (triangles) or 100 ng (circles) of PER2. (M) Comparison between the effect of PER2 and CLOCK used in (I) on PPARγ-mediated transcription in the presence of 10μM rosiglitazone. (***P<0.001).
Fig 2
Fig 2. PER2 and PPARγ interacting domains
(A) Schematic representation of PPARγ domains. (A/B) AF1 domain, (C) DNA binding domain, (D) flexible hinge region, (E) ligand binding domain, (F) AF2 domain. GST fusions proteins binding (+) or no binding (-) to 35SPER2 is shown. An example of GST pull-down is shown. (B) Transcriptional activity of PPRE3-TK-luc in the presence of PPARs isoforms and PER2 (+) or vector (-). (***P<0.001). (C) PER2 interaction with PPARγ is reduced by the S112A mutation. Top panel, IB of total cell lysates (INPUT) with α-Flag antibody. Middle panel, IB of precipitated Myc-PER2 and co-precipitated Flag-PPARγ or Flag-PPARγ S112A mutant. Bottom, immunoblot analysis of precipitated Myc-PER2. (D) GST immunoaffinity experiments using different concentration (0.1, 0.5, and 1 μg) of an unphosphorylated synthetic peptide (Unmodified) or its phosphorylated serine (PPARγ S112) version (Phospho) as competitors in binding reactions. (*P<0.05, **P<0.01 and ***P<0.001). (E) Repression by PER2 of activated PPARγ (WT) and PPARγ S112A (S112A) or (S112D) mutants. (***P<0.001). (F) ChIP assay on 3T3-L1 transiently expressing Flag-PPARγ wild-type (WT) or Flag-PPARγ S112A mutant (S112) and vector (-) or Myc-PER2 (+) (see experimental procedure). Immunoprecipitated DNA was analyzed by qPCR with specific primers for the Ap2 locus region flanking the PPAR Responsive Element (PPRE) or an upstream region (5′UR) (***P<0.001). (G) Schematic representation of PER2 domains (A) PASA, (B) PASB, (CKI) Casein Kinase Interacting, (PID) PPARγ Interacting Domain, (C) CRY interacting domain. Lower scheme, PER2 deleted in PID used in (H) and (I). (H) Flag-PPARγ immunoprecipitated from lysates of JEG3 cells transiently expressing Myc-PER2 or Myc-PER2 without PID (Myc-ΔPID). Total lysates (INPUT) and IP samples analyzed by WB with indicated antibodies. (I) Repression of PER2 and PER2ΔPID (ΔPID) on the activity of PPARγ- or CLOCK:BMAL1-dependent promoter targets (Ap2-luc or Per1-luc, respectively) (***P<0.001).
Fig 3
Fig 3. Deletion of Per2 affects adipocyte differentiation
WT and Per2-/- MEF cells expressing retroviral Myc-GFP (A and B), Myc-PER2 (C), or MycPER2ΔPID (Myc-ΔPID) (D) were stained with Oil Red O after inducing adipocyte differentiation. (E) The degree of differentiation analyzed by the fluorescent intensity of the Oil Red O staining. (***P<0.001). (F) MEFs in (A-D) were analyzed for expression of the adipocyte markers, Adiponectin and Ap2 by qRT-PCR. Values presented as fold induction of mRNA in differentiated versus undifferentiated MEF cells. (***P<0.001). (G) qRT-PCR analysis of Pparg, Per2, Per1 and Bmal1 from RNA samples prepared from 3T3-L1 cells collected before (day0) and after (day1-day7) adding the differentiation medium. (H) PPARγ was immunoprecipitated from lysates of 3T3-L1 cells collected at day0, day3 and day6 after adding differentiation media. Top, IB analysis of total cell lysates (INPUT) with an α-PER2 antibody. Middle, IB analysis of co-precipitated PER2. Bottom, IB analysis of immunoprecipitated PPARγ
Fig 4
Fig 4. Per2 deletion leads to activation of PPARγ-dependent BAT genes in WAT
(A) Functional classification of microarray data for the most significant upregulated genes in WAT from Per2-/- versus WT mice (PPDE>0.995). Percentage of genes sharing common biological processes is presented. Specific PPARγ-target genes in the lipid metabolism group are listed in Table S2. (B) Heat map comparison of significant upregulated genes in WAT from Per2-/- mice (Per2-/- WAT) with their expression in WT BAT and Per2-/- BAT. Expression values are presented as Log2 scale using different gradation of red color for genes upregulated 2-fold or more (Log2 ≥ 1), gray color for genes with fold change between -2 and +2 (-1 <Log2> +1), and blue color for genes down-regulated 2-fold or more (Log2 ≤ -1). Additional information is listed in Tables S2-S7. (C) Venn diagram illustrating overlapping upregulated genes in Per2-/- WAT (green), Per2-/- BAT (blue) and WT BAT (red). (D) RT-PCR Per2-/- BAT brown fat genes Ucp1, Elovl3 and Cidea in the WAT and BAT from Per2-/- and WT mice. (E) ChIP assay on WAT and BAT nuclear extracts. Chromatin samples were IPed with a α-PPARγ antibody and recovered DNA was analyzed by qPCR with specific primers for the aP2 locus region flanking the PPRE or an unrelated upstream region (5′UR). Data are presented as percentage of total input. (***P<0.001). (F) Schematic representation showing cellular localization and metabolic pathways of the products encoded by upregulated genes in WAT from Per2-/- mice. Gene full names and information are listed in Table S8. (G) Complex IV activity in Per2-/- and WT WAT. Shown as mean of activity (k * min-1) (*P<0.05). (H) CPT1 activity in Per2-/- and WT WAT. Shown as mean of activity (CPM/min/μg of protein) (*P<0.05).
Fig 5
Fig 5. Per2-/- mice present an altered lipid profile and increased oxidative capacity in WAT
(A-D) LC/MS analysis of TGA levels comparing WAT from Per2-/- and WT mice (A), NEFA (B), total saturated (SFA), monounsaturated (MUFA), polyunsaturated (PUFA) very long chain (VLCFA) (C) and long chain fatty acids (LCFA) (D). (*P < 0.05; **P < 0.01). (E) and (F) FFA oxidation in adipocytes was measured by 14CO2 released after 2h of incubation with 14C-palmitate and TTC staining. (G) Adipocytes cell size measured on dark-field images of paraformaldehyde-fixed sections of epidydimal adipose tissue. (H) Average cells diameter is shown in (G) (***P < 0.001). (I) Relative percentage of fraction of cells with different diameters.
Fig 6
Fig 6. Distinct pathways regulated by PER2
(A) Classical view of PER2 association with CRY to repress CLOCK:BMAL1-directed transcription to control circadian rhythms. (B) Here we have shown that PER2 functions as a critical metabolic regulator by repressing, in a CRY-independent manner, PPARγ-mediated activation of genes involved in adipogenesis and lipid metabolism. (C) We envisage that PER2 may contribute to the regulation of other pathways by specific interactions with selected, tissue-specific transcription factors.

References

    1. Akhtar RA, Reddy AB, Maywood ES, Clayton JD, King VM, Smith AG, Gant TW, Hastings MH, Kyriacou CP. Circadian cycling of the mouse liver transcriptome, as revealed by cDNA microarray, is driven by the suprachiasmatic nucleus. Curr Biol. 2002;12:540–550. - PubMed
    1. Bae K, Jin X, Maywood ES, Hastings MH, Reppert SM, Weaver DR. Differential functions of mPer1, mPer2, and mPer3 in the SCN circadian clock. Neuron. 2001;30:525–536. - PubMed
    1. Binas B, Han XX, Erol E, Luiken JJ, Glatz JF, Dyck DJ, Motazavi R, Adihetty PJ, Hood DA, Bonen A. A null mutation in H-FABP only partially inhibits skeletal muscle fatty acid metabolism. American journal of physiology. 2003;285:E481–489. - PubMed
    1. Compe E, Drane P, Laurent C, Diderich K, Braun C, Hoeijmakers JH, Egly JM. Dysregulation of the peroxisome proliferator-activated receptor target genes by XPD mutations. Molecular and cellular biology. 2005;25:6065–6076. - PMC - PubMed
    1. Duffield GE, Best JD, Meurers BH, Bittner A, Loros JJ, Dunlap JC. Circadian programs of transcriptional activation, signaling, and protein turnover revealed by microarray analysis of mammalian cells. Curr Biol. 2002;12:551–557. - PubMed

Publication types

Associated data