. 2010 Nov 3;12(5):533-44.
doi: 10.1016/j.cmet.2010.09.014.

High-fat-diet-induced obesity and heart dysfunction are regulated by the TOR pathway in Drosophila

Affiliations

High-fat-diet-induced obesity and heart dysfunction are regulated by the TOR pathway in Drosophila

Ryan T Birse et al. Cell Metab. .

Abstract

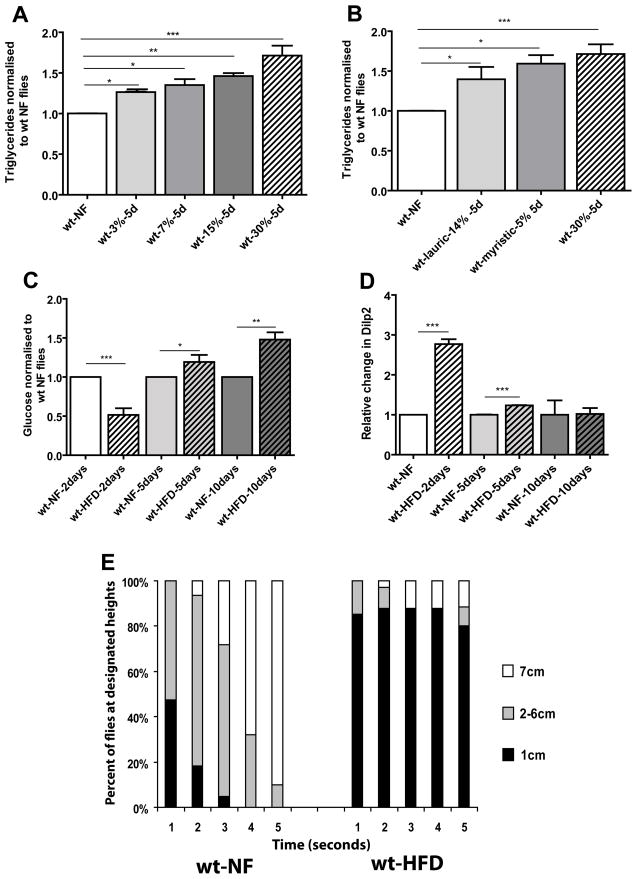
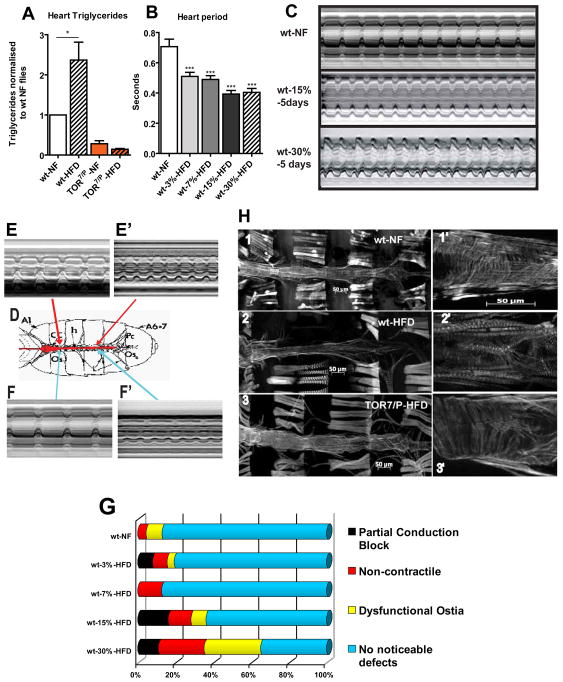
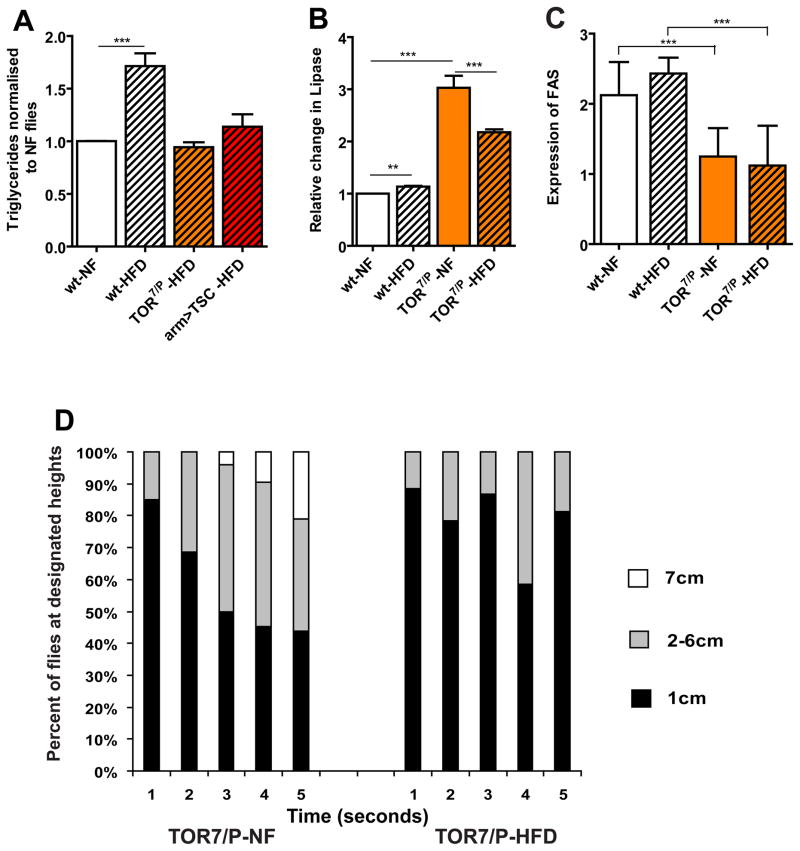
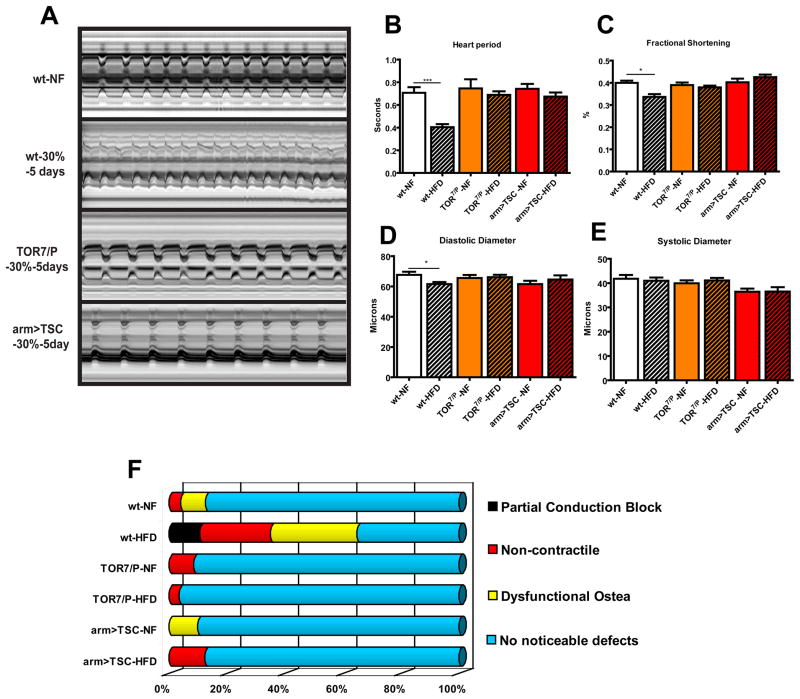
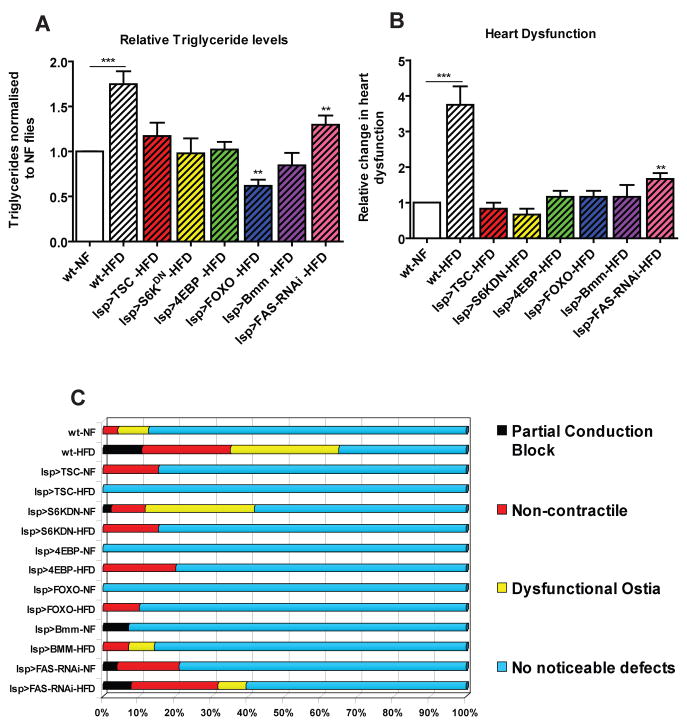
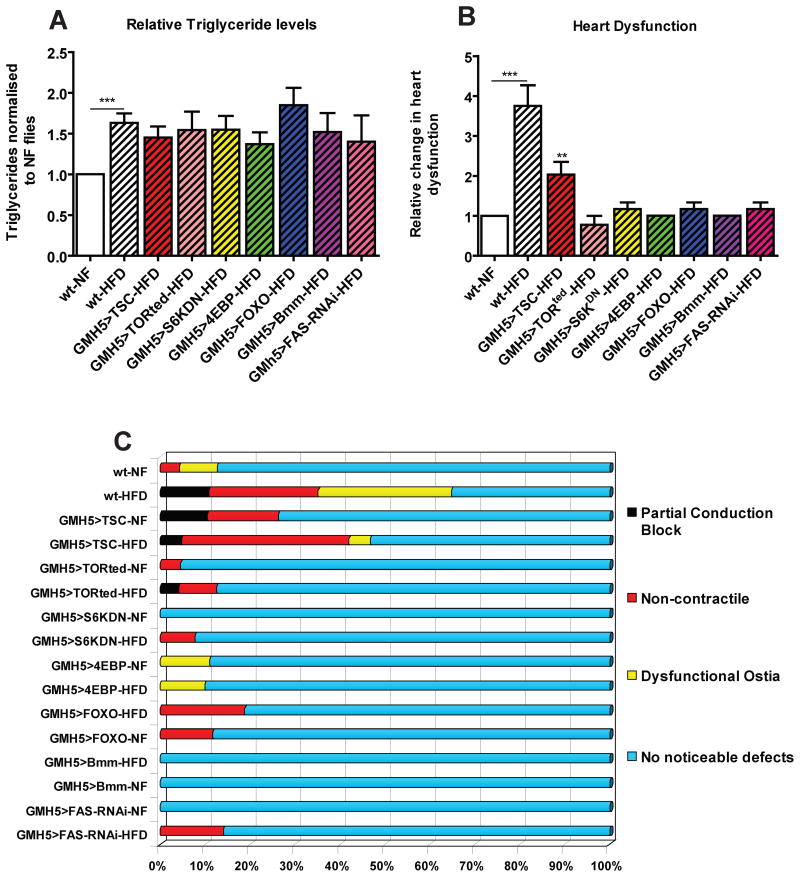
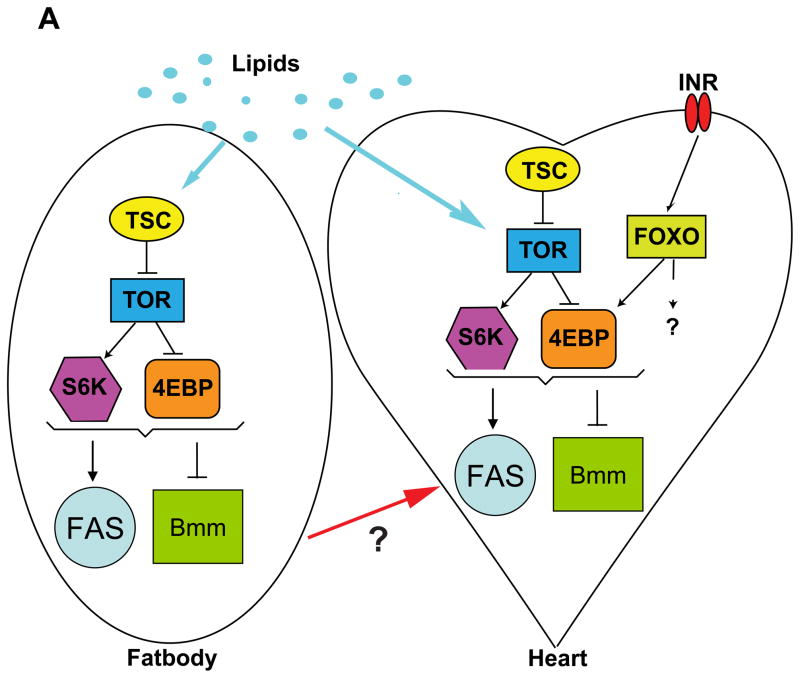
High-fat-diet (HFD)-induced obesity is a major contributor to diabetes and cardiovascular disease, but the underlying genetic mechanisms are poorly understood. Here, we use Drosophila to test the hypothesis that HFD-induced obesity and associated cardiac complications have early evolutionary origins involving nutrient-sensing signal transduction pathways. We find that HFD-fed flies exhibit increased triglyceride (TG) fat and alterations in insulin/glucose homeostasis, similar to mammalian responses. A HFD also causes cardiac lipid accumulation, reduced cardiac contractility, conduction blocks, and severe structural pathologies, reminiscent of diabetic cardiomyopathies. Remarkably, these metabolic and cardiotoxic phenotypes elicited by HFD are blocked by inhibiting insulin-TOR signaling. Moreover, reducing insulin-TOR activity (by expressing TSC1-2, 4EBP or FOXO), or increasing lipase expression-only within the myocardium-suffices to efficiently alleviate cardiac fat accumulation and dysfunction induced by HFD. We conclude that deregulation of insulin-TOR signaling due to a HFD is responsible for mediating the detrimental effects on metabolism and heart function.


Figures

Figure 1
Figure 1. HFD-induced obesity leads to metabolic syndrome in flies
A) Triglyceride content (expressed as relative change from NF flies) of 10–15 day old females on HFD for 5 days. The w1118 fly strain was used as wildtype (wt) in all experiments unless indicated otherwise. wt flies were used under 4 different concentrations of saturated fats. At least 3 independent experiments were done for each time point for all TG experiments. The concentrations used were 3 (n=46), 7 (n=49), 15 (n=31), 30% (n=81) for 5 days. wt type flies (n=107) showed a dose dependent increase in TGs (* = p<0.05, ** = p<0.01, ***= p<0.0001). B) Triglyceride content (expressed as relative change from NF flies) of 10–15 day old females on HFD for 5 days. The w1118 fly strain was used for the wildtype (wt) flies. wt flies were used two different types of saturated fats. Myristic and Lauric acid are both the major components of coconut oil. The amount of each fatty acid corresponds to its respective amount found in the 30% HFD. At least 3 independent experiments were done for each time point for all TG experiments. The concentrations used were lauric acid 14% (n=36), while myristic acid was 5% (n=35) and finally 30% of the original coconut oil mixture for 5 days. wt type flies showed a dose dependent increase in TGs (* = p<0.05, ** = p<0.01, ***= p<0.0001). C) Glucose content of female wt flies fed a 30% HFD (normalized to wt NF-fed flies of each appropriate age). Trehalose present in the hemolymph was converted to glucose (see M&M). Since 30% HFD gave us the strongest most consistent results we used 30% for all of the remaining experiments in this study. At least 3 independent experiments were done for each time point. After 2 days glucose decreases then rapidly increases after 5 and 10 days (* = p<0.05, ** = p<0.01, *** = p<0.0001). A minimum of 35 flies were used for each variable at each time point. D) Relative Dilp2 transcript levels in wt flies fed a 30% HFD for 2, 5 and 10 days. Dilp2 levels rapidly increase after 2 days then begin to decrease the longer the fly remains on a HFD (*** = p<0.0001). All qPCR were done in triplicate. E) Graphical representation of the effects of time and Geotaxic activity. Flies were filmed for 5 seconds then the movie was analyzed and individual flies were counted at each height 1cm being the lowest portion of the vial with 7 cm being the highest part of the vial. A minimum of 150 flies were used for each variable. All flies eventually moved to the top of the vial but we only counted the position of the flies to the allotted 5 second time span. Flies on a 30% HFD showed a significant decrease in geotaxic activity with approximately 80% remaining in the bottom of the vial for the allotted time span.
Figure 2
Figure 2. HFD treatment causes cardiac dysfunction
A) Triglyceride content from female hearts on NF and HFD for 5 days (normalized to wt NF hearts). TOR7/P mutant flies were examined under the same food conditions. At least 3 independent experiments were done for each time point for all TG experiments (with approximately 90 hearts were used for each condition and genotype). wt type flies showed an increase in TGs (* = p<0.05) while the TOR mutants had significantly lower levels of TGs that did not increase on a HFD. B) Bar graph representation of changes in heart period for a population of approximately 24 flies hearts from each food type. A dose dependent effect is shown for the increase in dietary fat content (***p<0.0001). A minimum of 22 flies were used for each dietary condition. C) M-mode traces prepared from high speed movies of semi-intact preparations on NF, 15%, and 30% HFDs for 5 days. Note the changes in the M-mode traces as the concentration of fat increases. Red bars indicate systolic and diastolic diameters. D) A sketch of a dissected semi-intact heart preparation. Arrows indicate to the area the corresponding M-modes shown in E–F′. E–E) Representation of partial conduction blocks of hearts using M-modes from different portions of the same heart. E) M-mode from the anterior portion of the heart displaying a regular heart beat. E) M-mode from the posterior portion of the same heart displaying a faster and erratic heart beating pattern, compared to I. F–F) Representation of a portion of the heart that is non-contractile hearts using M-modes of different heart regions. F) M-mode taken from the anterior portion of the heart displays regular beating pattern. F) M-mode taken from the posterior portion of the same heart showing poor or no contractions. G) Side bar graph of heart phenotypes seen under HFD conditions with increasing amount of fat. The heart phenotypes used in this graph are partial conduction blocks, non-contractile myocardial cells, dysfunctional ostia and no noticeable defects. The instances of all 3 phenotypes increase in a fat dose-dependent fashion. A minimum of 26 heart movies were analysed for each dietary condition. H) Fluorescent micrographs of hearts on NF and HFD for 5 days at 10x and 25x optical magnification. Adult hearts are stained with AlexaFlourR 594 phalloidin. 1) Adult heart of a wt flies on NF. 1) Magnified anterior NF-fed wt heart region. Note the regular arrangements of myofibrillar organization. 2) Adult heart of a wt flies on HFD for 5 days. Note the degeneration of the regular myofibrillar structure and the decrease in heart tube diameter. 2) Magnified anterior wt heart region on HFD. Note the disorganization of the circular myocardial myofibrils. 3) Adult heart of a TOR7/P mutant on a HFD for 5 days. Note that there is little to no degradation of heart structure and the diameter is not constricted. 3) Magnified anterior heart region of a TOR7/P mutant. There is little change in myocardial structure under HFD conditions compared to NF-fed wt (1′).
Figure 3
Figure 3. Reducing TOR function prevents HFD obesity
A) Comparison of changes in TG levels (expressed as relative change from NF flies) between wt, TOR7/P and systemic TSC1-2 overexpression (arm>TSC1-2 flies). At least 3 independent experiments were performed for each time point for all TG experiments. A significant increase in TGs were seen in wt flies (*** p<0.0001) fed a 30% HFD for 5 days, while TOR mutants (n=46) started with lower levels of TG under NF and these levels did not increase even on 30% HFD (n=48). arm>TSC flies (n=30) had similar levels as the wt control flies but these levels did not increase when placed on a HFD. B) Relative Bmm (AGTL Lipase) mRNA transcript levels. There is a slight increase in Lipase levels in wt under 30% HFD conditions (p<0.05). In contrast, TOR7/P mutants have a 3-fold increase in Bmm levels under NF conditions and remain high under HFD conditions. All qPCR were done in triplicate. C) Expression of FAS transcript levels in wt and TOR7/P mutants under both NF and 30% HFD conditions for 5 days. TOR7/P flies show significantly lower FAS mRNA levels than the corresponding wt flies on the same diets (** p<0.01). All qPCR were done in triplicate. D) Graphical representation of the effects of time and Geotaxic activity. Flies were filmed for 5 seconds then the movie was analyzed and individual flies were counted at each height 1cm being the lowest portion of the vial with 7 cm being the highest part of the vial. A minimum of 150 flies were used for each variable. All flies eventually moved to the top of the vial but we only counted the position of the flies to the allotted 5 second time span. Unlike wt, TOR7/P seem to have an inherent defect in their geotaxic yet this phenotype was exacerbated when fed a HFD.
Figure 4
Figure 4. Reducing TOR function prevents HFD-induced obesity cardiac dysfunction
A) M-mode traces of dissected wt flies on NF and 30% HFD, TOR7/P mutants and arm>TSC1-2 on NF and 30% HFD. No significant change was seen in TOR mutant nor arm<TSC heart M-modes on HFD when compared to wt on NF. B) Bar graph of cumulative heart periods for wt, TOR mutants (n=25, 36 respectively) and arm>TSC1-2 flies (n= 20 (NF), 21 (HFD)) under NF and HFD conditions. No change in heart period from wt under NF was seen in TOR mutants and arm>TSC1-2 flies under HFD conditions. C) Bar graph of changes in Fractional Shortening. A decrease in Fractional Shortening in wt flies was seen after 5 days on a 30% HFD (p<0.001). While no change was seen in fractional shortening in neither the TOR mutants nor the arm>TSC1-2 flies under a HFD. D) Bar graph of combined diastolic diameter data of wt and TOR mutant and arm>TSC1-2 hearts under NF and 30% HFD conditions. No change was seen in Diastolic Diameter in TOR mutants and arm>TSC1-2 flies under a HFD. E) Bar graph of systolic diameter of fly heart as in (F). No decrease in Systolic Diameter was seen after 5 days on a 30% HFD for any of the strains tested. F) Graphical representation of heart phenotypes as in Fig. 2G. No significant change the heart phenotype of TOR7/P mutants or with systemic TSC1-2 overexpression under HFD could be detected, when compared to wt flies. A minimum of 20 individual fly heart movies were analyses.
Figure 5
Figure 5. Fatbody-specific inhibition of TOR prevents obesity and heart phenotypes
A) Changes in TG content of wt and fatbody-specific (lsp-Gal4) expression of TSC1-2 (n=36), S6KDN (n=36), 4EBP (n=34), FOXO (n=48), Bmm (n=36) and FAS-RNAi (n=34). wt flies show a significant increase in TGs while all of the other flies show no significant increase in TG levels after 5 days on 30% HFD. B) Bar graph of relative change in heart dysfunction for fatbody-specific (lsp-Gal4) expression of TSC1-2 (n= 24), S6KDN (n=36), 4EBP (n=24), UAS-FOXO (n=36), UAS-Bmm (n=36) and UAS-FAS-RNAi (n=24). Only FAS-RNAi had a moderate increase in the severity of all 3 cardiac dysfunction phenotypes (see C) when compared to the same genotype under HFD. C) Side Bar graph of individual aberrant heart phenotypes for wt and fatbody-specific expression of TSC1-2, S6KDN, 4EBP, FOXO; FAS-RNAi and Bmm. Only FAS-RNAi had a moderate increase in heart abnormalities under a HFDA minimum of 24 individual fly heart movies were analysed for each genotype and diet variation.
Figure 6
Figure 6. Myocardial-specific inhibition of TOR autonomously blocks HFD heart effects despite obesity
A) Relative changes in TG content of wt and Myocardial-specific expression (GMH5-Gal4) of TSC1-2 (n=36), TORTed (n=36), S6KDN (n=48), 4EBP (n=36), FOXO (n=35), Bmm (n=48) and FAS-RNAi (n=36). All flies tested show a significant increase in TGs levels after 5 days on 30% HFD. B) Bar graph of relative change in heart dysfunction for myocardial-specific (GMH5) expression of TSC1-2 (n=23), TORted (n=24), S6KDN (n=35), 4EBP (n=42), FOXO (n=22), Bmm (n=33) and FAS-RNAi (n=25). Only TSC1-2 had an increase in the incidences of all 3 phenotypes when compared to the same genotype under HFD. C) Side Bar graph of individual aberrant heart phenotypes for myocardial-specific (GMH5) expression of TSC1-2, TORted, S6KDN, 4EBP, FOXO and Bmm. Only TSC1-2 had an increase in the incidences of all 3 phenotypes when compared to the same genotype under HFD. A minimum of 22 individual fly heart movies were analysed for each genotype and diet variation.
Figure 7
Figure 7. Model of insulin-TOR pathway funxction in HFD-induced obesity
A) Model for the effects of increased lipids on the insulin-TOR pathway in the fatbody and the heart.

Comment in

  • De-Toring high fat for a healthy heart.
    Zheng X. Zheng X. Expert Rev Cardiovasc Ther. 2011 Mar;9(3):299-302. doi: 10.1586/erc.11.18. Expert Rev Cardiovasc Ther. 2011. PMID: 21438808 No abstract available.

References

    1. Arking DE, Atzmon G, Arking A, Barzilai N, Dietz HC. Association between a functional variant of the KLOTHO gene and high-density lipoprotein cholesterol, blood pressure, stroke, and longevity. Circ Res. 2005;96:412–418. - PubMed
    1. Baker KD, Thummel CS. Diabetic larvae and obese flies-emerging studies of metabolism in Drosophila. Cell Metab. 2007;6:257–266. - PMC - PubMed
    1. Bentzinger CF, Romanino K, Cloetta D, Lin S, Mascarenhas JB, Oliveri F, Xia J, Casanova E, Costa CF, Brink M, Zorzato F, Hall MN, Ruegg MA. Skeletal muscle-specific ablation of raptor, but not of rictor, causes metabolic changes and results in muscle dystrophy. Cell Metab. 2008;8:411–424. - PubMed
    1. Bluher M, Michael MD, Peroni OD, Ueki K, Carter N, Kahn BB, Kahn CR. Adipose tissue selective insulin receptor knockout protects against obesity and obesity-related glucose intolerance. Dev Cell. 2002;3:25–38. - PubMed
    1. Bodmer R. Heart development in Drosophila and its relationship to vertebrate systems. Trends Cardiovasc Med. 1995;5:21–28. - PubMed

Publication types

MeSH terms