

Mechanics and computational simulation of blood flow in microvessels
- PMID: 21036096
- PMCID: PMC3115406
- DOI: 10.1016/j.medengphy.2010.09.016
Mechanics and computational simulation of blood flow in microvessels
Abstract
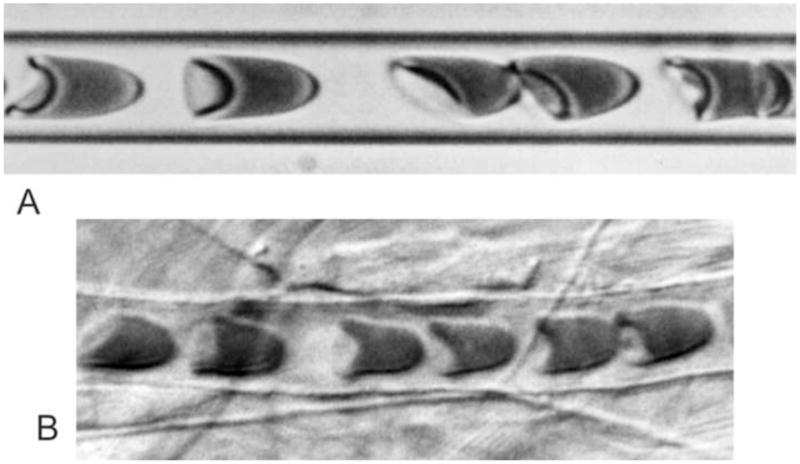
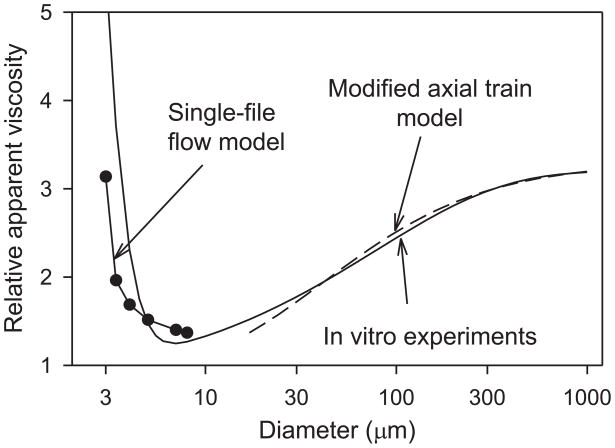
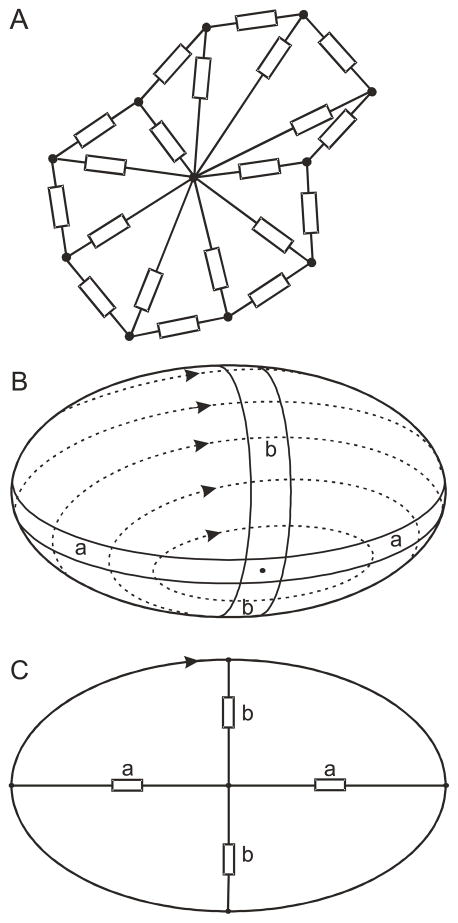
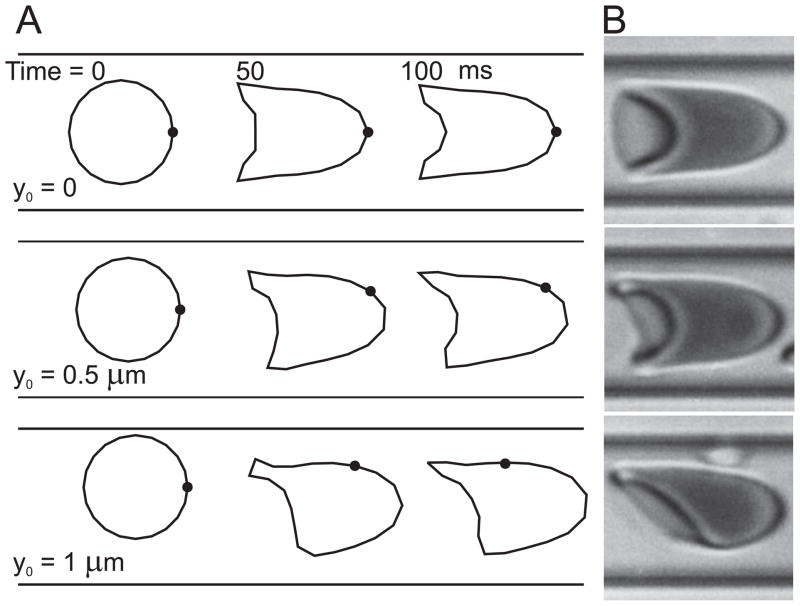
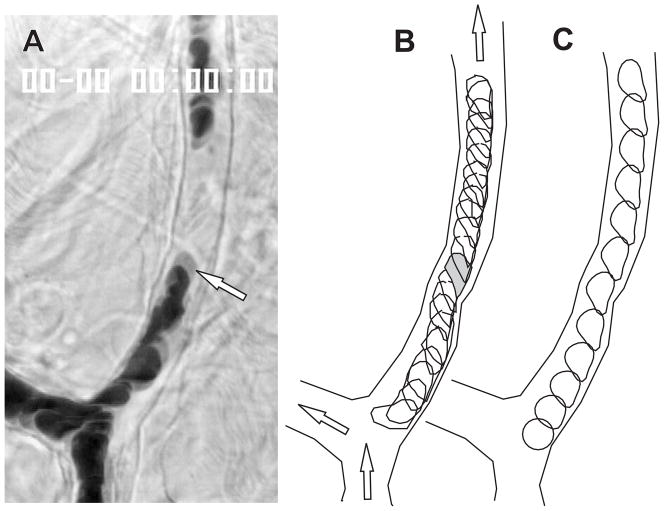
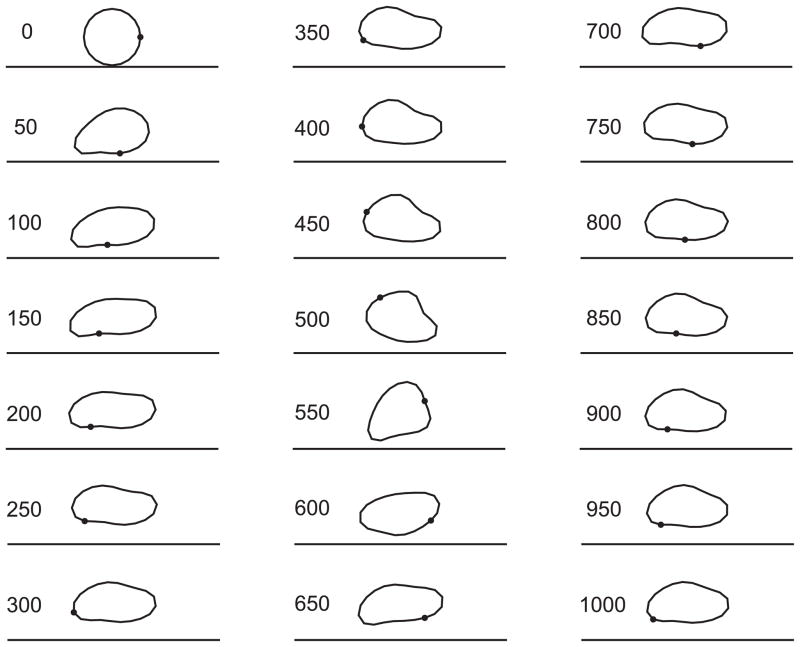
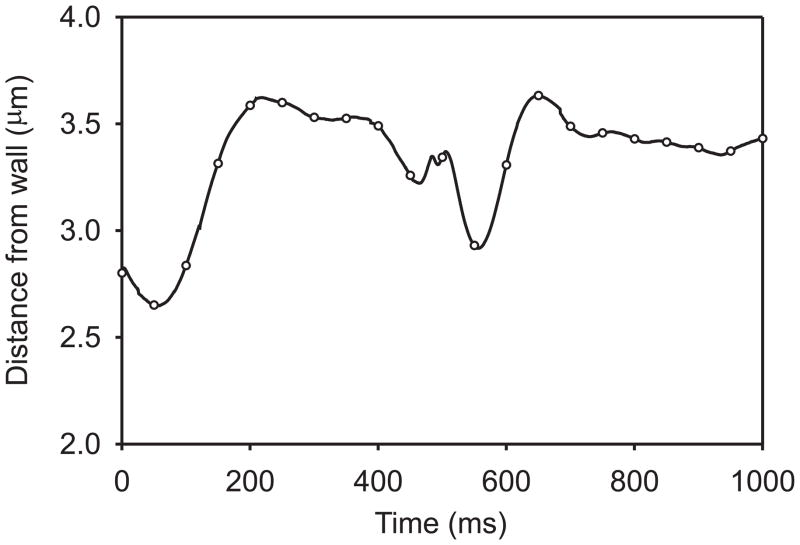
Blood is a concentrated suspension of red blood cells (RBCs). Motion and deformation of RBCs can be analyzed based on knowledge of their mechanical characteristics. Axisymmetric models for single-file motion of RBCs in capillaries yield predictions of apparent viscosity in good agreement with experimental results for diameters up to about 8 μm. Two-dimensional simulations, in which each RBC is represented as a set of interconnected viscoelastic elements, predict that off-centre RBCs in an 8-μm channel take asymmetric shapes and drift toward the centre-line. Predicted trajectories agree with observations in microvessels of the rat mesentery. An isolated RBC initially positioned near the wall of a 20-μm channel is deformed into an asymmetric shape, migrates away from the wall, and then enters a complex tumbling motion with continuous shape change. Realistic simulation of multiple interacting RBCs in microvessels remains as a major challenge.
Copyright © 2010 IPEM. Published by Elsevier Ltd. All rights reserved.
Figures
Similar articles
-
Two-dimensional simulation of red blood cell deformation and lateral migration in microvessels.Ann Biomed Eng. 2007 May;35(5):755-65. doi: 10.1007/s10439-007-9275-0. Epub 2007 Mar 23. Ann Biomed Eng. 2007. PMID: 17380392
-
Numerical Simulations of the Motion and Deformation of Three RBCs during Poiseuille Flow through a Constricted Vessel Using IB-LBM.Comput Math Methods Med. 2018 Feb 21;2018:9425375. doi: 10.1155/2018/9425375. eCollection 2018. Comput Math Methods Med. 2018. PMID: 29681999 Free PMC article.
-
Capture of microparticles by bolus flow of red blood cells in capillaries.Sci Rep. 2017 Jul 14;7(1):5381. doi: 10.1038/s41598-017-05924-7. Sci Rep. 2017. PMID: 28710401 Free PMC article.
-
Red blood cell mechanics and capillary blood rheology.Cell Biophys. 1991 Jun;18(3):231-51. doi: 10.1007/BF02989816. Cell Biophys. 1991. PMID: 1726534 Review.
-
Disturbed blood flow structuring as critical factor of hemorheological disorders in microcirculation.Clin Hemorheol Microcirc. 1998 Dec;19(4):315-25. Clin Hemorheol Microcirc. 1998. PMID: 9972669 Review.
Cited by
-
Normalization of Blood Viscosity According to the Hematocrit and the Shear Rate.Micromachines (Basel). 2022 Feb 24;13(3):357. doi: 10.3390/mi13030357. Micromachines (Basel). 2022. PMID: 35334649 Free PMC article.
-
Collective behavior of red blood cells in confined channels.Eur Phys J E Soft Matter. 2019 Apr 17;42(4):46. doi: 10.1140/epje/i2019-11805-0. Eur Phys J E Soft Matter. 2019. PMID: 30989403
-
Two-dimensional strain-hardening membrane model for large deformation behavior of multiple red blood cells in high shear conditions.Theor Biol Med Model. 2014 May 13;11:19. doi: 10.1186/1742-4682-11-19. Theor Biol Med Model. 2014. PMID: 24885482 Free PMC article.
-
A computational study of circulating large tumor cells traversing microvessels.Comput Biol Med. 2015 Aug;63:187-95. doi: 10.1016/j.compbiomed.2015.05.024. Epub 2015 Jun 10. Comput Biol Med. 2015. PMID: 26093786 Free PMC article.
-
Motion of red blood cells near microvessel walls: effects of a porous wall layer.J Fluid Mech. 2012 Aug;705:195-212. doi: 10.1017/jfm.2012.102. J Fluid Mech. 2012. PMID: 23493820 Free PMC article.
References
-
- Pries AR, Neuhaus D, Gaehtgens P. Blood viscosity in tube flow: dependence on diameter and hematocrit. American Journal of Physiology. 1992;263:H1770–H1778. - PubMed
-
- Fahraeus R, Lindqvist T. The viscosity of the blood in narrow capillary tubes. American Journal of Physiology. 1931;96:562–568.
-
- Goldsmith HL, Cokelet GR, Gaehtgens P. Robin Fahraeus: evolution of his concepts in cardiovascular physiology. Am J Physiol. 1989;257:H1005–H1015. - PubMed
-
- Secomb TW. Mechanics of blood flow in the microcirculation. Symp Soc Exp Biol. 1995;49:305–321. - PubMed
Publication types
MeSH terms
Grants and funding
LinkOut - more resources
Full Text Sources
