. 2010 Dec;4(6):539-61.
doi: 10.1016/j.molonc.2010.09.005. Epub 2010 Oct 8.

Tissue proteomics of the human mammary gland: towards an abridged definition of the molecular phenotypes underlying epithelial normalcy

Affiliations

Tissue proteomics of the human mammary gland: towards an abridged definition of the molecular phenotypes underlying epithelial normalcy

José M A Moreira et al. Mol Oncol. 2010 Dec.

Abstract

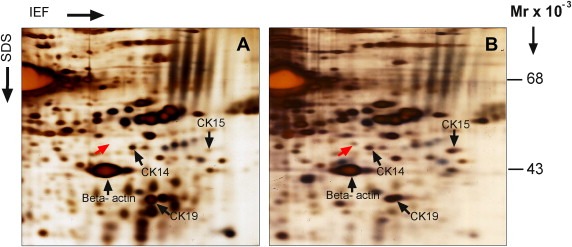
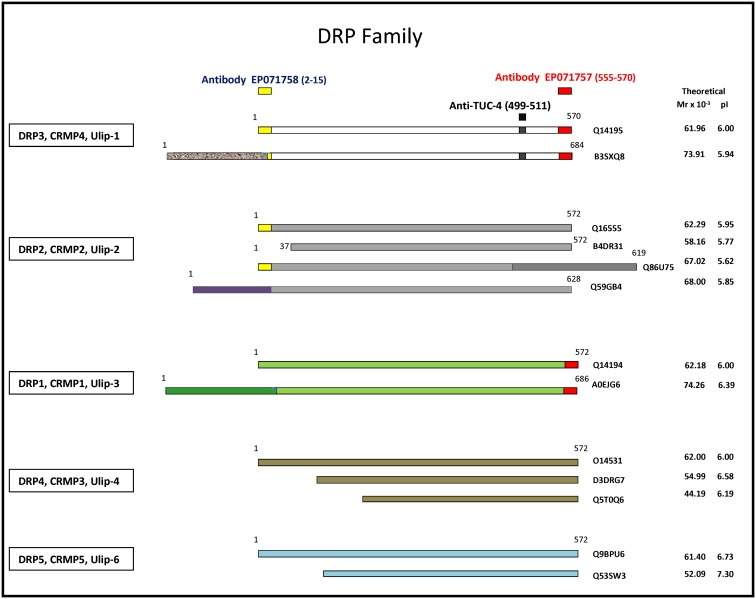
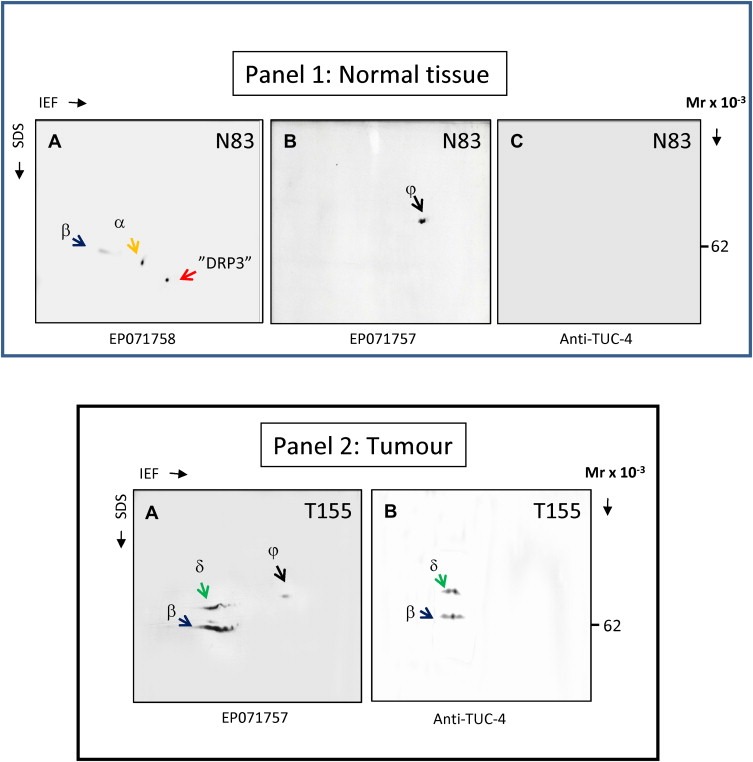
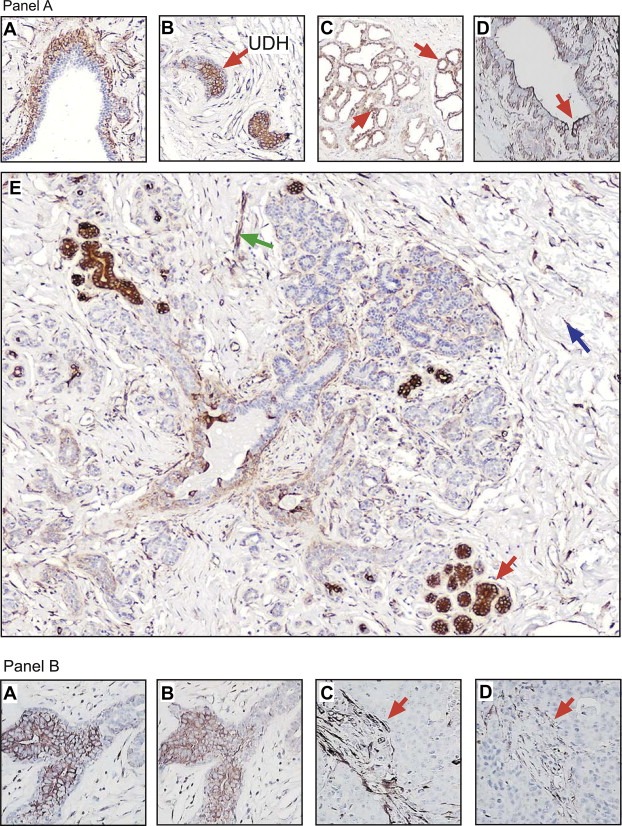
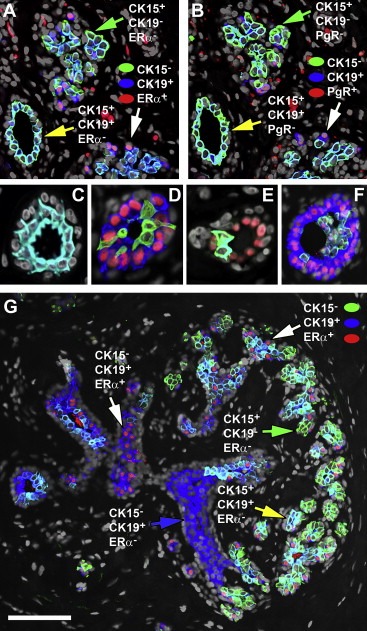
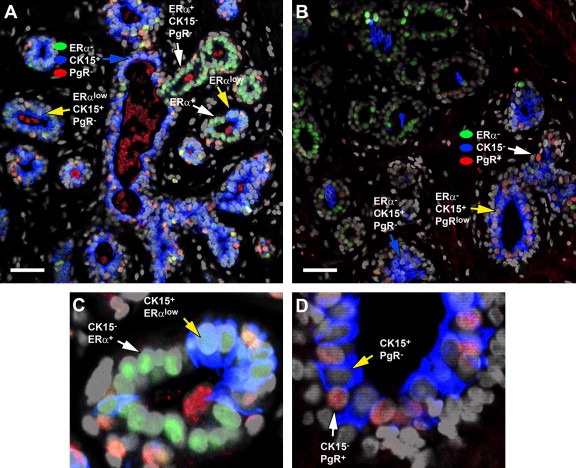
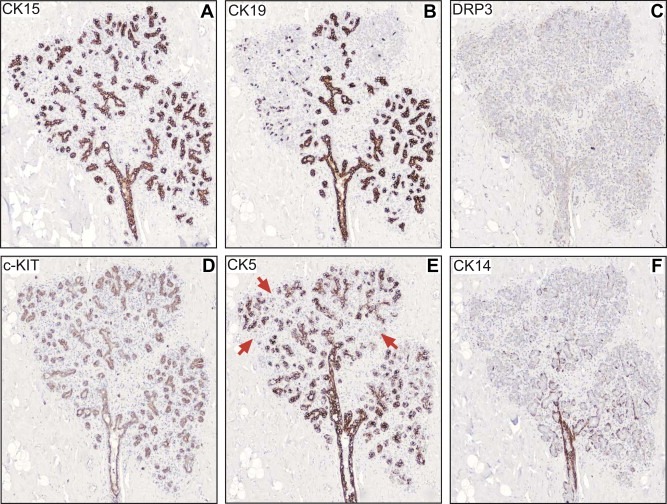
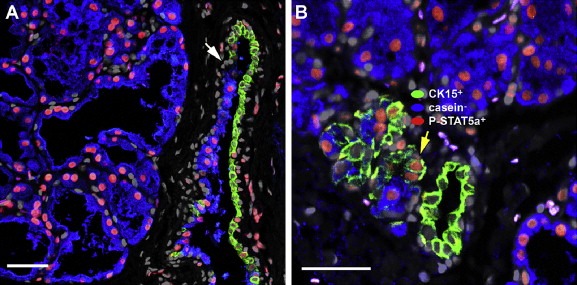
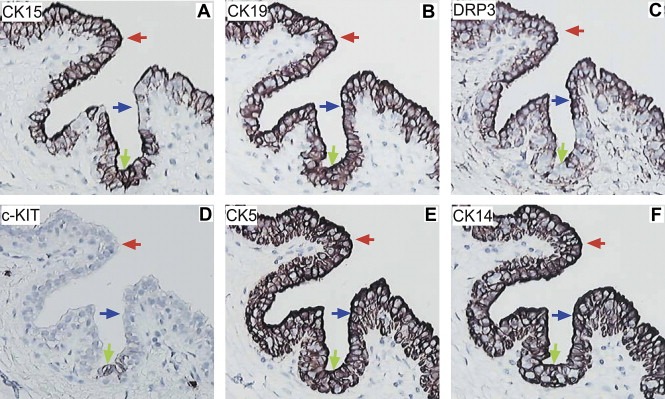
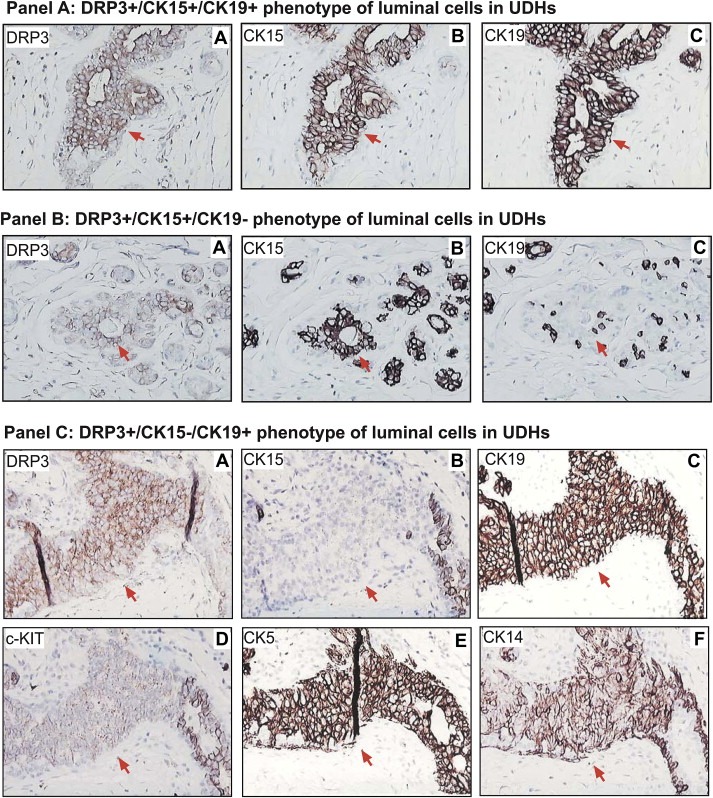
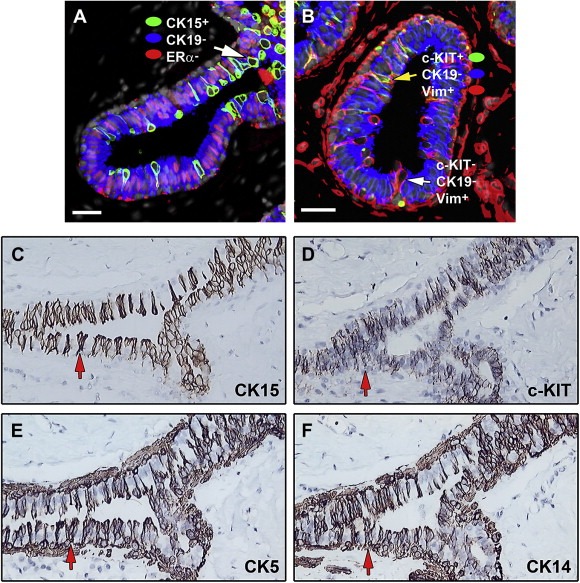
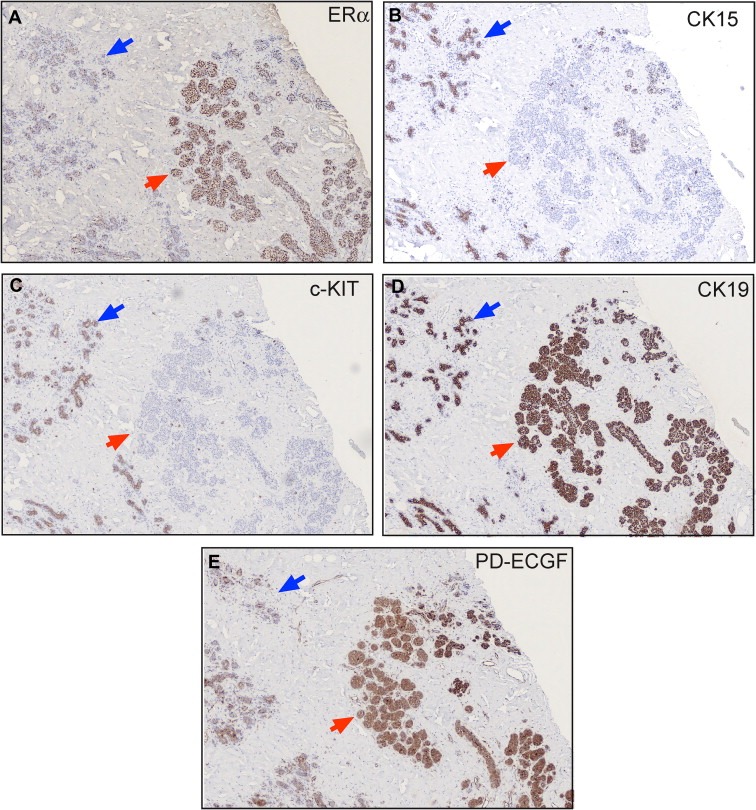
Our limited understanding of the biological impact of the whole spectrum of early breast lesions together with a lack of accurate molecular-based risk criteria for the diagnosis and assignment of prognostic significance to biopsy findings presents an important problem in the clinical management of patients harboring precancerous breast lesions. As a result, there is a need to identify biomarkers that can better determine the outcome of early breast lesions by identifying subpopulations of cells in breast premalignant disease that are at high-risk of progression to invasive disease. A first step towards achieving this goal will be to define the molecular phenotypes of the various cell types and precursors - generated by the stem cell hierarchy - that are present in normal and benign conditions of the breast. To date there have been very few systematic proteomic studies aimed at characterizing the phenotypes of the different cell subpopulations present in normal human mammary tissue, partly due to the formidable heterogeneity of mammary tissue, but also due to limitations of the current proteomic technologies. Work in our laboratories has attempted to address in a systematic fashion some of these limitations and here we present our efforts to search for biomarkers using normal fresh tissue from non-neoplastic breast samples. From the data generated by the 2D gel-based proteomic profiling we were able to compile a protein database of normal human breast epithelial tissue that was used to support the biomarker discovery program. We review and present new data on the putative cell-progenitor marker cytokeratin 15 (CK15), and describe a novel marker, dihydropyriminidase-related protein 3 (DRP3) that in combination with CK15 and other well known proteins were used to define molecular phenotypes of normal human breast epithelial cells and their progenitors in resting acini, lactating alveoli, and large collecting ducts of the nipple. Preliminary results are also presented concerning DRP3 positive usual ductal hyperplasias (UDHs) and on single cell layer columnar cells (CCCs). At least two bona fide biomarkers of undifferentiated ERα/PgR negative luminal cells emerged from these studies, CK15 and c-KIT, which in combination with transformation markers may lead to the establishment of a protein signature able to identify breast precancerous at risk of progressing to invasive disease.


Figures

Figure 1
Figure 1
Illustration of differential protein expression in samples with opposite relative amounts of UDH lesions. Magnified sections of representative 2‐D PAGE gels run with lysates from non‐malignant tissue samples containing (A) low or (B) higher relative levels of UDHs are shown. Gels were visualized by silver nitrate staining. Arrows indicate the positions of a differentially expressed protein (red arrow) and reference proteins (CK14, CK19, CK15 and β‐actin; black arrows).
Figure 2
Figure 2
Schematic representation of DRP protein family members. DRP proteins −1 to −5 are presented in different colors with known variants (truncated and long variants) shown. In each case differences in domain structure in the long variants are indicated with colored boxes. The location of the immunogens for antibodies EP071758 (yellow box), anti‐TUC‐4 (black box), and EP07175 (red box) are presented and the aa positions indicated. In each case the calculated Mr and pI is indicated as well as the SwissProt accession number.
Figure 3
Figure 3
Determination of antibody specificity by 2D immunoblot analysis. Lysates of tissue specimens were resolved by 2D PAGE (IEF). The resolved proteins were blotted onto a nitrocellulose membrane, and DRP3 protein(s) detected with EP071758 (Panel 1 sub‐figure A), EP071757 (Panel 1 sub‐figure B, and Panel 2 sub‐figure A) or anti‐TUC‐4 antibody (Panel 1 sub‐figure C, and Panel 2 sub‐figure B), respectively. The immunoblot protein patterns varied in normal (Panel 1) or tumor tissues (Panel 2). Different variants are indicated with color‐coded arrows and identified with captions “α, β, γ, and δ”.
Figure 4
Figure 4
Expression analysis of DRP3 in formalin‐fixed paraffin embedded breast tissue samples. (Panel A) Immunohistochemical staining of DRP3 protein in normal breast tissue samples demonstrated the presence of the DRP antigen in (sub‐figure A) myoepithelial cells lining normal ducts, (sub‐figure B) luminal cells within some UDHs, (sub‐figure C) lactating cells, (sub‐figure D) collecting ducts, and in some (sub‐figure E) resting acinar structures. Cells indicated with red arrows show illustrative DRP3 immunoreactivity. (Panel B) IHC analysis of tandem tissue sections showed that immunoreactivity of EP071757 (sub‐figure A) and anti‐TUC‐4 antibodies (sub‐figure B) was comparable. Immunoreactivity of DRP3 was enhanced in tumor samples but predominantly located in stromal cells both with EP071757 (sub‐figure C) and anti‐TUC‐4 antibodies (sub‐figure D).
Figure 5
Figure 5
Nuclear receptor status in the various CK15/CK19 cell populations. Indirect four color immunofluorescence analysis of serial tissue sections from a normal breast specimen reacted with antibodies against cytokeratin 15 (CK15, Alexa Fluor® 488; green channel), cytokeratin 19 (CK19, Alexa Fluor® 594; red channel), and (A) ERα or (B) PgR (ER or PgR, Alexa Fluor® 633; blue channel), and counterstained with the nuclear stain DAPI (grey channel). (C–F) Illustrative images of acinar structures stained with CK15 (Alexa Fluor® 488; green channel), ERα (Alexa Fluor® 594; red channel), and cytokeratin 19 (Alexa Fluor® 633; blue channel) showing varying degrees of hyperplasia. (G) A low magnification view of a ductal tree illustrating the various cellular phenotypes observed and the negative correlation between ERα and CK15. Scale bar, 100 μm. In all cases only merged images are shown.
Figure 6
Figure 6
Negative correlation of nuclear receptor status and CK15 expression. Indirect four color immunofluorescence analysis of a normal breast specimen reacted with antibodies against ERα (ER, Alexa Fluor® 488; green channel), PgR (PgR, Alexa Fluor® 594; red channel), and cytokeratin 15 (CK15, Alexa Fluor® 633; blue channel), counterstained with the nuclear stain DAPI (grey channel). (C and D) Enlarged regions of the sections presented in A and B panels, respectively, illustrating the negative correlation between (C) ERα or (D) PgR, and CK15. Scale bar, 50 μm. In all cases only merged images are shown.
Figure 7
Figure 7
IHC analysis of serial sections of paraffin‐embedded normal breast tissue stained with antibodies against (A) CK15, (B) CK19, (C) DRP3, (D) c‐KIT, (E) CK5 and (F) CK14. The red arrows in (E) indicate CK5 negative acini.
Figure 8
Figure 8
Indirect four color immunofluorescence analysis of lactating alveoli reacted with antibodies against cytokeratin 15 (CK15, Alexa Fluor® 488; green channel) P‐Stat5a (P‐STAT5a, Alexa Fluor® 594; red channel), casein (casein, Alexa Fluor® 633; blue channel), counterstained with the nuclear stain DAPI (grey channel). Lactating breast tissue samples presented (A) undifferentiated CK15+/P‐Stat5a−/casein− cells present occasionally within lactating alveoli or in transitional structures. In a few cases (B) one could observe CK15+/P‐Stat5a+/casein− cells.
Figure 9
Figure 9
Immunohistochemical analysis of large collecting ducts of the nipple in normal breast tissue. Serial tissue sections of normal breast specimens were stained with antibodies against (A) CK15, (B) CK19, (C) DRP3, (D) c‐KIT, (E) CK5, and (F) CK14 allowing the immunophenotyping of cells present at the collecting ducts.
Figure 10
Figure 10
Immunophenotyping of luminal cells in UDHs. IHC analysis of serial tissue sections of normal breast tissue containing DRP3 positive UDHs. Serial tissue sections were stained with antibodies against DRP3, CK15 and CK19, allowing identification of three major DRP3+ cellular phenotypes: (panel A) DRP3+ (sub‐figure A)/CK15+ (sub‐figure B)/CK19+ (sub‐figure C), (panel B) DRP3+ (sub‐figure A)/CK15+ (sub‐figure B)/CK19− (sub‐figure C), and (panel C) DRP3+ (sub‐figure A)/CK15− (sub‐figure B)/CK19+ (sub‐figure C). Red arrows indicate cells with these phenotypes.
Figure 11
Figure 11
Immunophenotyping of columnar cell changes. (A and B) Indirect four color immunofluorescence analysis of tissue sections containing CCCs with antibodies against (A) cytokeratin 15 (CK15, Alexa Fluor® 488; green channel), ERα (ER, Alexa Fluor® 594; red channel), and cytokeratin 19 (CK19, Alexa Fluor® 633; blue channel), counterstained with the nuclear stain DAPI (grey channel) and (B) against c‐KIT (c‐KIT, Alexa Fluor® 488; green channel), vimentin (Vim, Alexa Fluor® 594; red channel), and cytokeratin 19 (CK19, Alexa Fluor® 633; blue channel), counterstained with the nuclear stain DAPI (grey channel). (C–F) Immunohistochemical analysis of CCCs. Serial tissue sections of normal breast specimens were stained with antibodies against (C) CK15, (D) c‐KIT, (E) CK5, and (F) CK14 to immunophenotype cells present at CCCs.
Figure 12
Figure 12
IHC analysis of serial sections of paraffin‐embedded normal breast tissue stained with antibodies against (A) ERα, (B) CK15, (C) c‐KIT, (D) CK19 and (E) PD‐ECGF, also known as endothelial cell growth factor (ECGF).

Similar articles

Cited by

References

    1. Abdel-Fatah, T.M.A. , Powe, D.G. , Hodi, Z. , Lee, A.H.S. , Reis-Filho, J.S. , Ellis, I.O. , 2007. High frequency of coexistence of columnar cell lesions, lobular neoplasia, and low grade ductal carcinoma in situ with invasive tumular carcinoma and invasive lobular carcinoma. Am. J. Surg. Pathol. 31, 417–426. - PubMed
    1. Adriance, M.C. , Inman, J.L. , Petersen, O.W. , Bissell, M.J. , 2005. Myoepithelial cells: good fences make good neighbors. Breast Cancer Res. 7, 190–197. - PMC - PubMed
    1. In Altekruse S.F., Kosary C.L., Krapcho M., Neyman N., Aminou R., Waldron W., Ruhl J., Howlader N., Tatalovich Z., Cho H., Mariotto A., Eisner M.P., Lewis D.R., Cronin K., Chen H.S., Feuer E.J., Stinchcomb D.G., Edwards B.K.(Eds.), SEER Cancer Statistics Review, 1975–2007. National Cancer Institute; Bethesda, MD:
    1. Bánkfalvi, A. , Ludwig, A. , De-Hesselle, B. , Buerger, H. , Buchwalow, I.B. , Boecker, W. , 2004. Different proliferative activity of the glandular and myoepithelial lineages in benign proliferative and early malignant breast diseases. Mod. Pathol. 17, 1051–1061. - PubMed
    1. Barbareschi, M. , Pecciarini, L. , Cangi, M.G. , Macrì, E. , Rizzo, A. , Viale, G. , Doglioni, C. , 2001. p63, a p53 homologue, is a selective nuclear marker of myoepithelial cells of the human breast. Am. J. Surg. Pathol. 25, 1054–1060. - PubMed

Publication types

MeSH terms