

Wood dust sampling: field evaluation of personal samplers when large particles are present
- PMID: 21036895
- PMCID: PMC3037778
- DOI: 10.1093/annhyg/meq075
Wood dust sampling: field evaluation of personal samplers when large particles are present
Abstract
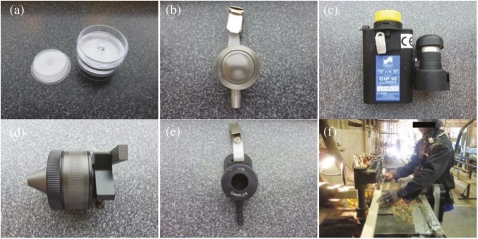
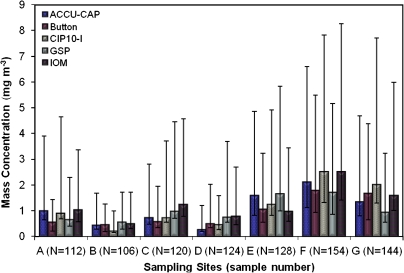
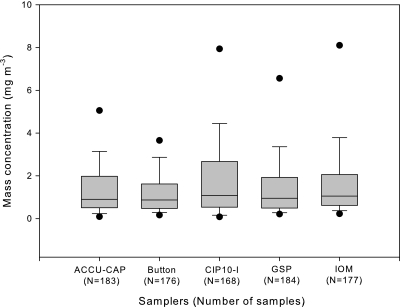
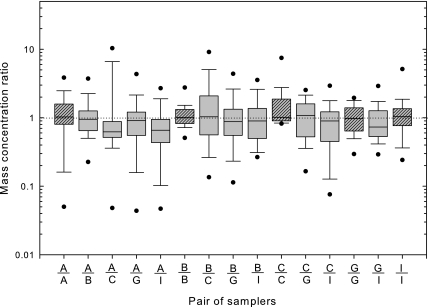
Recent recommendations for wood dust sampling include sampling according to the inhalable convention of International Organization for Standardization (ISO) 7708 (1995) Air quality--particle size fraction definitions for health-related sampling. However, a specific sampling device is not mandated, and while several samplers have laboratory performance approaching theoretical for an 'inhalable' sampler, the best choice of sampler for wood dust is not clear. A side-by-side field study was considered the most practical test of samplers as laboratory performance tests consider overall performance based on a wider range of particle sizes than are commonly encountered in the wood products industry. Seven companies in the wood products industry of the Southeast USA (MS, KY, AL, and WV) participated in this study. The products included hardwood flooring, engineered hardwood flooring, door skins, shutter blinds, kitchen cabinets, plywood, and veneer. The samplers selected were 37-mm closed-face cassette with ACCU-CAP™, Button, CIP10-I, GSP, and Institute of Occupational Medicine. Approximately 30 of each possible pairwise combination of samplers were collected as personal sample sets. Paired samplers of the same type were used to calculate environmental variance that was then used to determine the number of pairs of samples necessary to detect any difference at a specified level of confidence. Total valid sample number was 888 (444 valid pairs). The mass concentration of wood dust ranged from 0.02 to 195 mg m(-3). Geometric mean (geometric standard deviation) and arithmetic mean (standard deviation) of wood dust were 0.98 mg m(-3) (3.06) and 2.12 mg m(-3) (7.74), respectively. One percent of the samples exceeded 15 mg m(-3), 6% exceeded 5 mg m(-3), and 48% exceeded 1 mg m(-3). The number of collected pairs is generally appropriate to detect a 35% difference when outliers (negative mass loadings) are removed. Statistical evaluation of the nonsimilar sampler pair results produced a finding of no significant difference between any pairing of sampler type. A practical consideration for sampling in the USA is that the ACCU-CAP™ is similar to the sampler currently used by the Occupational Safety and Health Administration for purposes of demonstrating compliance with its permissible exposure limit for wood dust, which is the same as for Particles Not Otherwise Regulated, also known as inert dust or nuisance dust (Method PV2121).
Figures
References
-
- Aitken RJ, Donaldson R. Large particle and wall deposition effects in inhalable samplers. HSE Contract Research Report No. 117/19996. Sudbury, Suffolk, UK: Health and Safety Executive Books; 1996.
-
- Aizenberg V, Grinshpun SA, Willeke K, et al. Performance characteristics of the button personal inhalable aerosol sampler. Am Ind Hyg Assoc J. 2000;61:398–404. - PubMed
-
- ACGIH. Threshold limit values for chemical substances and physical agents and biological exposure indices. Cincinnati, OH: ACGIH Worldwide; 2001.
-
- ACGIH. TLVs and BEIs based on the documentation of the threshold limit values for chemical substances and physical agents and biological exposure indices. Cincinnati, OH: ACGIH; 2009.
-
- Bartley DL. Inhalable aerosol samplers. Appl Occup Environ Hyg. 1998;13:274–78.
Publication types
MeSH terms
Substances
Grants and funding
LinkOut - more resources
Full Text Sources
Medical
Miscellaneous
