. 2010 Dec 31;285(53):41852-62.
doi: 10.1074/jbc.M110.171330. Epub 2010 Oct 29.

Identification of a calcium permeable human acid-sensing ion channel 1 transcript variant

Affiliations

Identification of a calcium permeable human acid-sensing ion channel 1 transcript variant

Erin N Hoagland et al. J Biol Chem. .

Abstract

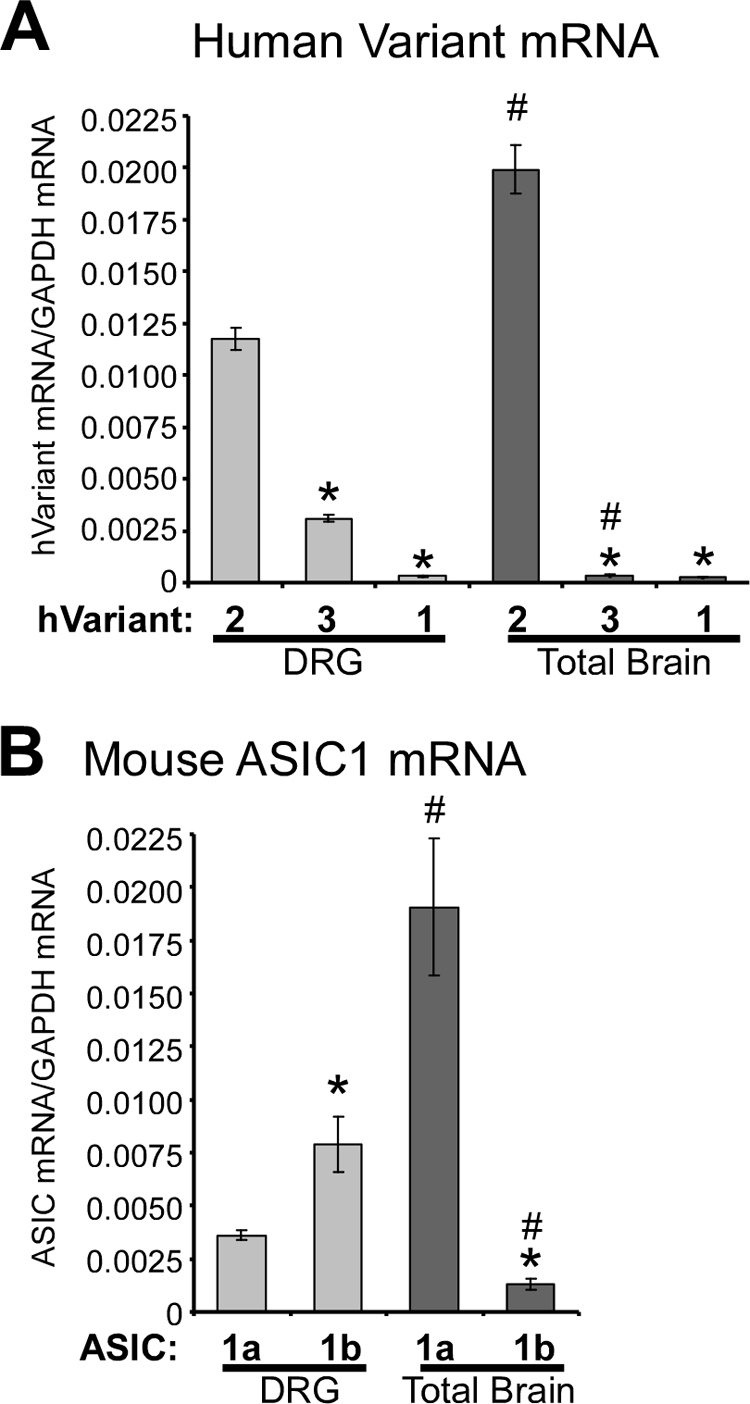
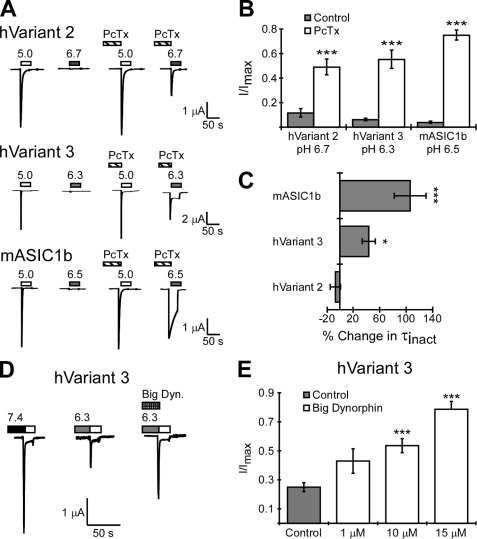
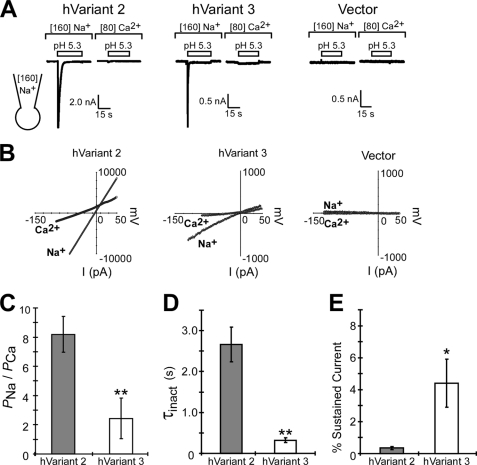
The acid-sensing ion channels (ASICs) are proton-gated cation channels activated when extracellular pH declines. In rodents, the Accn2 gene encodes transcript variants ASIC1a and ASIC1b, which differ in the first third of the protein and display distinct channel properties. In humans, ACCN2 transcript variant 2 (hVariant 2) is homologous to mouse ASIC1a. In this article, we study two other human ACCN2 transcript variants. Human ACCN2 transcript variant 1 (hVariant 1) is not present in rodents and contains an additional 46 amino acids directly preceding the proposed channel gate. We report that hVariant 1 does not produce proton-gated currents under normal conditions when expressed in heterologous systems. We also describe a third human ACCN2 transcript variant (hVariant 3) that is similar to rodent ASIC1b. hVariant 3 is more abundantly expressed in dorsal root ganglion compared with brain and shows basic channel properties analogous to rodent ASIC1b. Yet, proton-gated currents from hVariant 3 are significantly more permeable to calcium than either hVariant 2 or rodent ASIC1b, which shows negligible calcium permeability. hVariant 3 also displays a small acid-dependent sustained current. Such a sustained current is particularly intriguing as ASIC1b is thought to play a role in sensory transduction in rodents. In human DRG neurons, hVariant 3 could induce sustained calcium influx in response to acidic pH and make a major contribution to acid-dependent sensations, such as pain.


Figures

FIGURE 1.
FIGURE 1.
Human ACCN2 transcript variants. A, schematic of the human ACCN2 gene located on chromosome 12 (at positions 9917749 to 9940609 of the genome assembly NW001838057.1). Coding exons are indicated by rectangles on a continuous line and numbered according to location. Common hVariant 1- and 2-specific exons are striped. The alternatively spliced portion of exon 9 (in 9b), which is unique in hVariant 1, is dotted. The hVariant 3-specific coding exon (3b) is dark gray. Note that the exon encoding the specific region of hVariant 3 is not yet annotated as an exon within the human genome reference sequence. B, schematic of the resulting transcript variants from the human ACCN2 gene. The numbers represent the coding exons illustrated above. hVariant 2 is homologous to rodent ASIC1a. hVariant 3 has sequence similarity to rodent ASIC1b. C, ClustalW alignment showing divergence in the predicted protein sequence of hVariant 1 and hVariant 2. Bold residues are conserved between hVariant 1 and hVariant 2. The amino acid sequence of the inserted region in hVariant 1 is illustrated at the top. The DEG residue, present just before the desensitization gate (at the “DIGG” sequence), is underlined in hVariant 2 (42). Notice the inclusion of an homologous glycine in the LG sequence (in bold) replicated within the inserted region just prior to the desensitization gate of hVariant 1. The predicted protein domains are indicated under the amino acid sequences. The gray bar represents the location of transmembrane domain 2, as predicted by the crystal structure (4, 42). The solid line represents the extracellular domain and the hatched box represents a β-sheet region (4). The intracellular region is indicated by the wavy line beneath the sequence. D, ClustalW alignment of the first third of the predicted protein sequences of hVariant 3, mouse ASIC1b (mASIC1b), and hVariant 2. Residues in bold are identical to amino acids in hVariant 3. Asterisk below represents identity between all three sequences. The colon or dot below represent conserved amino acids. Underline indicates the position of Ala93 in hVariant 3, which is a serine in polymorphism dbSNP: rs706792. The relative location of the intracellular region is indicated by the wavy line below the sequence. Transmembrane domain 1 is indicated by a gray box. Gray bars represent α helical regions and hatched bars represent β-sheet regions (4, 42).
FIGURE 2.
FIGURE 2.
Expression analysis of human and mouse ASIC1 transcript variants. A, relative levels of human ACCN2 variant mRNA determined using quantitative real time PCR from human total brain and DRG. Data are presented as the relative level of the indicated transcript normalized to GAPDH (n = 3, see “Experimental Procedures” for details). B, relative levels of mouse ASIC1a and ASIC1b in mouse brain and DRG determined by quantitative real time PCR (n = 3). Error bars represent the mean ± S.E. The asterisk indicates p < 0.05 between hVariant 2 or mASIC1a in the same tissue; # indicates p < 0.05 compared with the same transcript in total brain using unpaired Student's t test.
FIGURE 3.
FIGURE 3.
Basic properties of ACCN2 transcript variants. A, representative traces of proton-gated current using the two-electrode voltage clamp of X. laevis oocytes injected with hVariant 2, hVariant 1, hVariant 3, and mouse ASIC1b (mASIC1b). Channels were activated with pH 5.0 solutions (white bars) from a holding pH of 7.4. B, quantification of peak current amplitude of pH 5.0-activated currents in oocytes injected with human ACCN2 transcript variants and mouse ASIC1b. Note that hVariant 1 failed to produce appreciable proton-gated currents (n = 14- 20 oocytes). C, inactivation kinetics of ACCN2 transcript variants. The τ of inactivation was calculated by fitting the decay phase of pH 5.0-activated current to an exponential equation (n = 24- 45 oocytes). D, quantification of the acid-dependent sustained current in oocytes expressing ACCN2 transcript variants. Sustained current was measured during the plateau phase after pH 5.0-induced activation and normalized to the peak current amplitude (n = 13–19 oocytes). E–G, I/V plots of hVariant 2 (E), hVariant 3 (F), and mASIC1b (G) currents activated in the presence of different extracellular ions. pH 5.0-activated currents were measured at the indicated holding potential using solutions with either 116 mm Na+, 116 mm Li+, or 116 mm K+. I/I[Na+]max is the peak current amplitude evoked by pH 5.0 at the given holding potential normalized to the current amplitude evoked by pH 5.0 in the Na+ solution at a holding potential of −60 mV (n = 4–6). Error bars are mean ± S.E. The asterisk indicates p < 0.05; double asterisk indicates a p < 0.01; and a triple asterisk indicates a p < 0.001 using an ANOVA (one-way).
FIGURE 4.
FIGURE 4.
pH-dependent activation and desensitization of ACCN2 transcript variants. A, representative trace of the pH dependence of activation in oocytes expressing hVariant 2, hVariant 3, and mASIC1b. The activating pH is indicated by bars above the trace. B, quantification of the pH dependence of current activation. Current was produced by perfusion of bath solution from pH 7.4 to the indicated pH. I/Imax is the current produced by application of the test pH normalized to current evoked by pH 5.0 solutions (n = 5–14). C, representative traces showing steady-state desensitization of hVariant 2, hVariant 3, and mASIC1b. Basal pH was 7.9. The shaded bars above the trace indicate the conditioning pH (applied for 2 min), and the white bars indicate activating pH 5.0. D, concentration-response curve of steady-state desensitization. I/Imax is the current evoked from experimental conditioning pH normalized to pH 5.0-evoked current evoked from a conditioning pH of 7.9 (n = 5–21). Error bars are mean ± S.E.
FIGURE 5.
FIGURE 5.
Modulation of human ACCN2 transcript variant 3 by PcTx1 and Big Dynorphin. A, representative traces showing PcTx1 enhancement of ASIC1 activation. Proton-gated currents were activated by the indicated pH (white bar indicates pH 5.0, gray bars indicate pH 6.7, 6.3, or 6.5 as indicated) in the presence or absence of PcTx1 (60 nm). The pH used for activation was different between channels. This is because PcTx1 enhances the current by shifting the apparent proton sensitivity of activation. Because the proton sensitivity of each channel is different, we chose a pH that produces <15% maximal activation on average (pH 6.7 induces 11.5% current from hVariant 2, pH 6.3 induced 6.1% current from hVariant 3, pH 6.5 induces 3.8% activation from mASIC1b). B, quantification of PcTx1 (60 nm) effect on activation by submaximal pH applications (n = 5–7). Triple asterisks indicates a p < 0.001 between PcTx1 and control conditions using Student's t test. C, quantification of the change in the τ of inactivation of pH 5.0-evoked current in the presence of PcTx1. Fractional change represents the difference in τinact (in seconds) with and without PcTx1 modulation normalized to the τinact without PcTx1. A value of zero would indicate no change with PcTx1 application. D, representative trace of Big Dynorphin (15 μm) modulation of hVariant 3 steady-state desensitization induced by conditioning in pH 6.3 and activating with pH 5.0 (white bar). E, quantification of Big Dynorphin modulation of steady-state desensitization of hVariant 3. I/Imax is current from control or Big Dynorphin normalized to control currents (evoked from pH 6.3 in the absence of any intervention). Triple asterisks indicates a p < 0.001 between Big Dynorphin (at the given concentration) and control conditions using Student's t test (n = 4–19). Error bars represent the mean ± S.E.
FIGURE 6.
FIGURE 6.
Calcium permeability of ACCN2 transcript variant 3 expressed in CHO cells. A, representative trace of proton-gated currents in CHO cells transfected with hVariant 2, hVariant 3, and vector (pMT3). Recordings were done using whole cell patch clamp with extracellular solutions containing 160 mm NaCl or 80 mm CaCl. Pipette solution contained 160 mm NaCl. B, representative I/V plot of voltage ramp (−100 to +50 mV) applied during the transient (inactivating) phase of pH 5.3-activated current. C, quantification of the average calculated sodium/calcium permeability ratio (PNa/PCa) of acid-activated currents from CHO cells expressing hVariant 2 and hVariant 3 (n = 7–9). D, quantification of the τ of inactivation (τinact) calculated from the decay phase of pH 5.3-activated proton-gated currents from CHO cells transfected with human hVariant2 or -3 in sodium-containing solutions. E, quantification of the sustained phase of pH 5.3-activated currents in CHO cells transfected with hVariants 2 or 3 in sodium-containing solutions. “% Sustained” current was calculated by measuring the residual current 10 s after activation and normalizing it to peak current amplitude. Asterisk indicates a p < 0.05 and double asterisk indicated a p < 0.02 using the Student's t test. Error bars are mean ± S.E.

References

    1. Dubé G. R., Elagoz A., Mangat H. (2009) Curr. Pharm. Des. 15, 1750–1766 - PubMed
    1. Benos D. J., Stanton B. A. (1999) J. Physiol. 520, 631–644 - PMC - PubMed
    1. Kellenberger S., Schild L. (2002) Physiol. Rev. 82, 735–767 - PubMed
    1. Jasti J., Furukawa H., Gonzales E. B., Gouaux E. (2007) Nature 449, 316–323 - PubMed
    1. Waldmann R., Champigny G., Bassilana F., Heurteaux C., Lazdunski M. (1997) Nature 386, 173–177 - PubMed

Publication types

Associated data