. 2011 Jan;21(1):56-67.
doi: 10.1101/gr.110684.110. Epub 2010 Oct 29.

Discovery of non-ETS gene fusions in human prostate cancer using next-generation RNA sequencing

Affiliations

Discovery of non-ETS gene fusions in human prostate cancer using next-generation RNA sequencing

Dorothee Pflueger et al. Genome Res. 2011 Jan.

Abstract

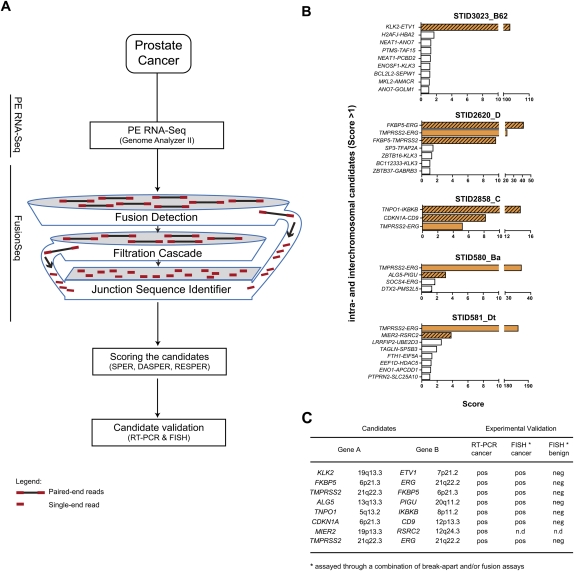
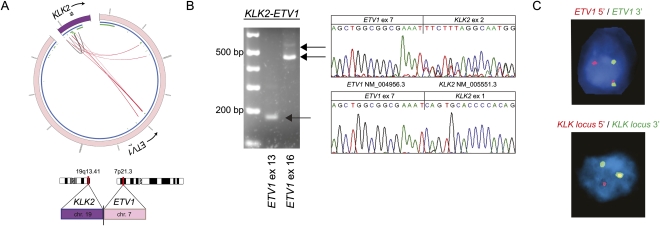
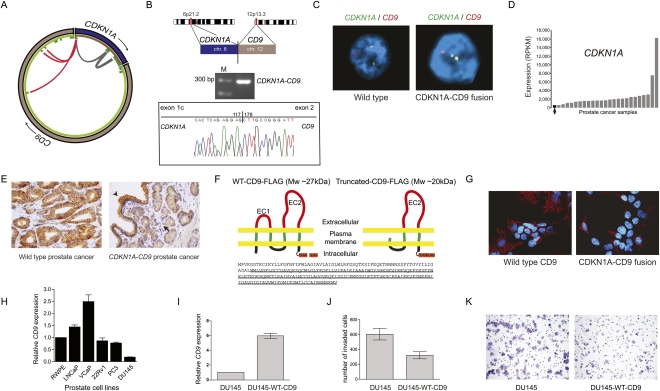
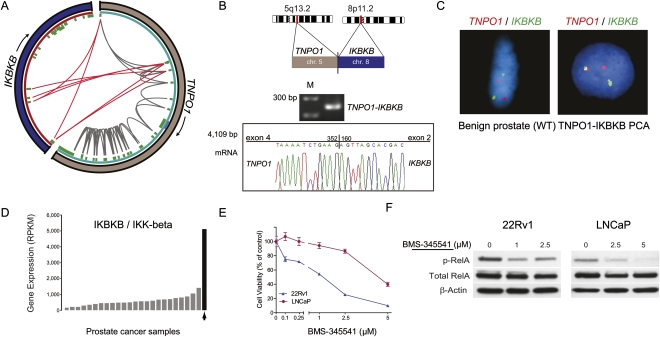
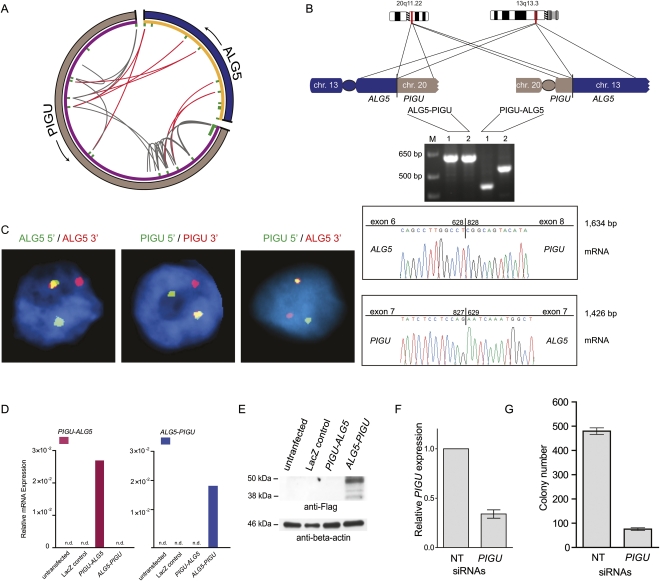
Half of prostate cancers harbor gene fusions between TMPRSS2 and members of the ETS transcription factor family. To date, little is known about the presence of non-ETS fusion events in prostate cancer. We used next-generation transcriptome sequencing (RNA-seq) in order to explore the whole transcriptome of 25 human prostate cancer samples for the presence of chimeric fusion transcripts. We generated more than 1 billion sequence reads and used a novel computational approach (FusionSeq) in order to identify novel gene fusion candidates with high confidence. In total, we discovered and characterized seven new cancer-specific gene fusions, two involving the ETS genes ETV1 and ERG, and four involving non-ETS genes such as CDKN1A (p21), CD9, and IKBKB (IKK-beta), genes known to exhibit key biological roles in cellular homeostasis or assumed to be critical in tumorigenesis of other tumor entities, as well as the oncogene PIGU and the tumor suppressor gene RSRC2. The novel gene fusions are found to be of low frequency, but, interestingly, the non-ETS fusions were all present in prostate cancer harboring the TMPRSS2-ERG gene fusion. Future work will focus on determining if the ETS rearrangements in prostate cancer are associated or directly predispose to a rearrangement-prone phenotype.


Figures

Figure 1.
Figure 1.
FusionSeq identifies seven high-scoring intra- and interchromosomal candidates that could be validated positively in five prostate cancer samples. (A) Schematic of the computational processes composing FusionSeq. (B) List of candidates within five samples. Candidates with negative DASPER scores were removed, and the remaining candidates were sorted anticlimactic by RESPER (referred to as Score) with a cutoff of 1. True gene fusions (solid orange, known TMPRSS2–ERG fusions; striated orange, novel gene fusions) score higher than candidates that appear down the list (white bars). (C) The novel gene fusions were experimentally validated using RT-PCR and FISH.
Figure 2.
Figure 2.
Identification of KLK2 as novel 5′ fusion partner of ETV1. (A) Circos plot of KLK2–ETV1 rearrangement. Outer ring: (purple) chromosome 19; (pink) chromosome 7. Inner ring: (blue) genes; (green) exons. Within the inner ring, lines denote PE reads with both reads belonging to KLK2 (gray) and reads connecting ETV1 and KLK2 (red). (B) RT-PCR and Sanger sequencing of the resulting fusion transcript reveals the expression of two different fusion transcripts. PCR products were sequenced using the reverse primer, so sequence traces are given in reverse orientation. (C) ETV1 and the KLK locus are rearranged as determined by FISH break-apart assays. Of note, KLK2-specific FISH is not feasible due to the small size of the KLK2 gene and its close location to neighboring genes of the KLK locus. To address this, genomic rearrangement of the KLK2 gene is inferred from a rearrangement in the genomic locus of the KLK gene family.
Figure 3.
Figure 3.
Characterization of the CDKN1A–CD9 gene fusion candidate. (A) Mapping of PE RNA-seq reads to CDKN1A with either both ends mapping to CDKN1A (gray) or one end mapping to CD9 (red) and thereby connecting CDKN1A exon 1 to 3′ exons of CD9. (B) Experimental validation of the gene fusion transcript by RT-PCR and subsequent Sanger sequencing. (C) FISH validation of the CDKN1A–CD9 fusion in the index case (right) but not in another control cancer (left). (D) The fusion positive prostate cancer sample (black) has the lowest CDKN1A expression levels across 25 prostate cancers. Expression levels are indicated in reads per kilobase of exon model per million mapped reads (RPKM) as defined previously (Mortazavi et al. 2008). (E) Immunodetection of CD9 by immunohistochemistry. (Left) Strong CD9 membranous expression detected in malignant glands from a prostate cancer sample without a detectable CD9 rearrangement. (Right) Malignant glands in CDKN1A–CD9 fusion positive case (arrow) showing weak membranous expression in comparison to adjacent benign areas (arrowhead). (F) Schematic illustration of Flag-tagged WT–CD9 and Flag-tagged CDKN1A–CD9 fusion protein. The fusion event leads to a truncated CD9 protein with loss of two transmembrane domains and the small extracellular domain (EC1). (Bottom) The amino acid sequence of WT–CD9 protein with the truncated CD9 protein version underlined. (G) Immunofluorescence staining revealed the expression of WT–CD9 and truncated CD9 in HEK293 cells stained with anti-Flag (red) antibody. Nuclei were stained with DAPI (blue). (H) Expression levels of CD9 mRNA transcripts in prostate cell lines. (I) CD9 expression from control or stably CD9-expressing DU145 cells. (J) Bar graph comparing the invasiveness of the two lines as assessed by Boyden chamber assays. (K) Representative images of invaded cells for each cell line.
Figure 4.
Figure 4.
Characterization of the TNPO1–IKBKB gene fusion candidate. (A) Mapping of PE RNA-seq reads to TNPO1 with either or both ends mapping to TNPO1 (gray) or one end mapping to IKBKB (red). (B) Experimental validation by RT-PCR and Sanger sequencing verifies the expression of a TNPO1–IKBKB fusion transcript. (C) Fusion specific FISH assays confirm the existence of TNPO1–IKBKB fusion in cancer tissue (right) but not in adjacent benign tissue (left). (D) IKBKB expression levels in a set of 25 prostate cancers. IKBKB levels are highest in the fusion positive sample (black). (E) Dose response curve assessing the effect of the IKK-beta inhibitor BMS-345541 on viability of LNCaP and 22Rv1 prostate cancer cells. (F) Immunoblots depicting the effect of BMS-345541 exposure on RelA phosphorylation in LNCaP and 22Rv1 cells.
Figure 5.
Figure 5.
Characterization of the reciprocal balanced translocation event involving PIGU and ALG5. (A) Circos plot of ALG5–PIGU rearrangement. In the outer ring, (gray) chromosome 20 and (blue) chromosome 13. Genes are represented in purple (PIGU) and orange (ALG5) on the inner ring. Within the inner ring, each line denotes paired-end reads with either both ends mapping to PIGU (gray) or one end mapping to PIGU and the other end to ALG5 (red). The red lines connect 5′ ALG5 to 3′ PIGU and vice versa, thereby indicating a balanced translocation event. (B) Experimental validation of the two resulting gene fusions by RT-PCR and subsequent Sanger sequencing of the resulting PCR products. Two different primer pairs were used for verification of each gene fusion transcript indicated as 1 and 2. (C) FISH validation of the ALG5–PIGU fusion in the index case by break-apart assays (left and middle) and a fusion assay (right). (D) Expression of ALG5–PIGU and PIGU–ALG5 messages, as determined by quantitative PCR following transfection of the indicated constructs in HEK293 cells. (E) Immunoblot analysis on the transfected HEK293 cells showing protein expression only in ALG5–PIGU transfected cells. (F,G) LNCaP cells were treated with nontargeting (NT) siRNAs or siRNAs against PIGU to assay for effect of anchorage-independent growth in soft agar. (F) Bar graph showing expression of PIGU after siRNA treatment. (G) LNCaP cells treated with PIGU siRNAs show reduced colony formation ability.

Similar articles

Cited by

References

    1. Berger MF, Levin JZ, Vijayendran K, Sivachenko A, Adiconis X, Maguire J, Johnson LA, Robinson J, Verhaak RG, Sougnez C, et al. 2010. Integrative analysis of the melanoma transcriptome. Genome Res 20: 413–427 - PMC - PubMed
    1. Bergsagel PL, Kuehl WM 2001. Chromosome translocations in multiple myeloma. Oncogene 20: 5611–5622 - PubMed
    1. Burke JR, Pattoli MA, Gregor KR, Brassil PJ, MacMaster JF, McIntyre KW, Yang X, Iotzova VS, Clarke W, Strnad J, et al. 2003. BMS-345541 is a highly selective inhibitor of IκB kinase that binds at an allosteric site of the enzyme and blocks NF-κB-dependent transcription in mice. J Biol Chem 278: 1450–1456 - PubMed
    1. Carver BS, Tran J, Gopalan A, Chen Z, Shaikh S, Carracedo A, Alimonti A, Nardella C, Varmeh S, Scardino PT, et al. 2009. Aberrant ERG expression cooperates with loss of PTEN to promote cancer progression in the prostate. Nat Genet 41: 619–624 - PMC - PubMed
    1. Chariot A 2009. The NF-κB-independent functions of IKK subunits in immunity and cancer. Trends Cell Biol 19: 404–413 - PubMed

Publication types

MeSH terms