. 2010 Dec;133(Pt 12):3676-84.
doi: 10.1093/brain/awq281. Epub 2010 Oct 29.

White matter abnormalities in methcathinone abusers with an extrapyramidal syndrome

Affiliations

White matter abnormalities in methcathinone abusers with an extrapyramidal syndrome

Ainars Stepens et al. Brain. 2010 Dec.

Abstract

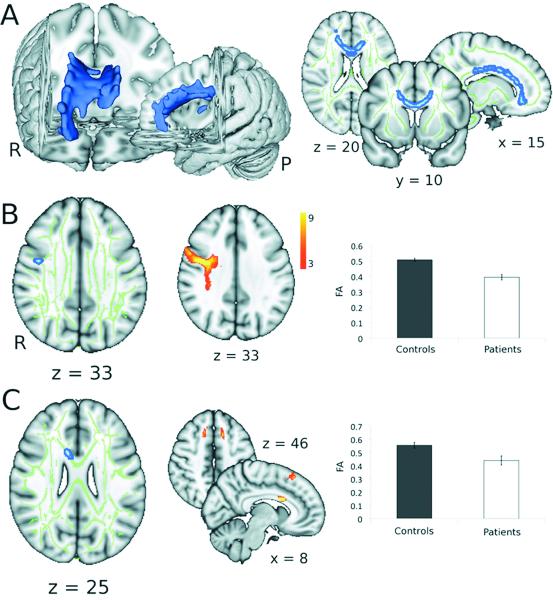
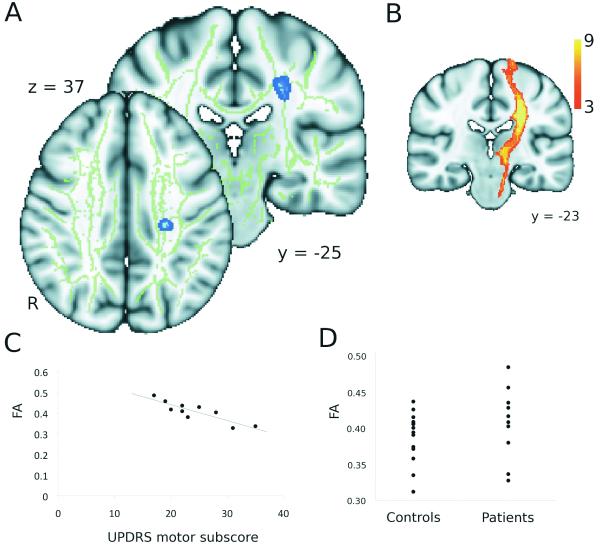
We examined white matter abnormalities in patients with a distinctive extrapyramidal syndrome due to intravenous methcathinone (ephedrone) abuse. We performed diffusion tensor imaging in 10 patients and 15 age-matched controls to assess white matter structure across the whole brain. Diffuse significant decreases in white matter fractional anisotropy, a diffusion tensor imaging metric reflecting microstructural integrity, occurred in patients compared with controls. In addition, we identified two foci of severe white matter abnormality underlying the right ventral premotor cortex and the medial frontal cortex, two cortical regions involved in higher-level executive control of motor function. Paths connecting different cortical regions with the globus pallidus, the nucleus previously shown to be abnormal on structural imaging in these patients, were generated using probabilistic tractography. The fractional anisotropy within all these tracts was lower in the patient group than in controls. Finally, we tested for a relationship between white matter integrity and clinical outcome. We identified a region within the left corticospinal tract in which lower fractional anisotropy was associated with greater functional deficit, but this region did not show reduced fractional anisotropy in the overall patient group compared to controls. These patients have widespread white matter damage with greatest severity of damage underlying executive motor areas.


Figures

Figure 1
Figure 1. Group differences in fractional anisotropy between patients and controls
A. Blue regions indicate areas showing a significant reduction in fractional anisotropy in patients compared to controls in a cluster-based analysis (significant clusters have been thickened for ease of visualization) (TFCE; corrected p < 0.05). Widespread abnormalities are observed in white matter tracts within the central regions of the brain, more peripheral tracts are relatively unaffected. B & C. Areas showing decreased fractional anisotropy in patients compared to controls using voxel-based thresholding. First column shows regions of significant reduction in fractional anisotropy in yellow (significant clusters have been thickened for ease of visualization) (t > 3.76; p < 0.001 (uncorrected); cluster extent > 25 mm3). The mean fractional anisotropy skeleton is shown in green and the areas of significant difference illustrated in figure 1A are shown in blue. The middle column shows the paths (derived using high-resolution diffusion data from healthy volunteers) originating from the clusters of significant difference shown in the first column where the colour coding reflects the proportion of the population in which a tract is present. Tracts have been thresholded to show only those present in 3 or more subjects. Third column shows the mean fractional anisotropy in patients and in controls within the significant clusters.
Figure 2
Figure 2. Correlations with clinical score
A. The blue region indicates an area showing a significant correlation between UPDRS motor subscore and fractional anisotropy using voxel-based thresholding (t > 4.78, p < 0.001 (uncorrected), cluster extent > 25 mm3). B. The results of probabilistic tractography using this region as a seed mask in high-resolution data, demonstrating it lies within the left corticospinal tract, where the colour coding reflects the proportion of the population in which a tract is present. Tracts have been thresholded to show only those present in at least 3/9 subjects. C. Correlation between the UPDRS motor subscore and the fractional anisotropy within this region. D. Range of fractional anisotropy within this region in patients and controls. (Points represent individual subjects).

References

    1. Aron AR, Robbins TW, Poldrack RA. Inhibition and the right inferior frontal cortex. Trends Cogn Sci. 2004;8:170–7. - PubMed
    1. Assaf Y, Blumenfeld-Katzir T, Yovel Y, Basser PJ. Axcaliber: A method for measuring axon diameter distribution from diffusion MRI. Magn Reson Med. 2008;59:1347–54. - PMC - PubMed
    1. Assaf Y. Can we use diffusion MRI as a bio-marker of neurodegenerative processes? BioEssays. 2008;30(11-12):1235–45. - PubMed
    1. Beaulieu C. The biological basis of diffusion anisotropy. In: Johansen-Berg H, Behrens TEJ, editors. Diffusion MRI: From quantitative measurement to in-vivo neuroanatomy. Elsevier; London: 2009.
    1. Behrens T, Woolrich M, Jenkinson M, Johansen-Berg H, Nunes R, Clare S, et al. Characterization and propogation of uncertainty in diffusion-weighted MR imaging. Magn Reson Med. 2003;50:1077–88. - PubMed

Publication types

MeSH terms