

Novel application of structural equation modeling to correlation structure analysis of CpG island methylation in colorectal cancer
- PMID: 21037082
- PMCID: PMC2993288
- DOI: 10.2353/ajpath.2010.100361
Novel application of structural equation modeling to correlation structure analysis of CpG island methylation in colorectal cancer
Abstract
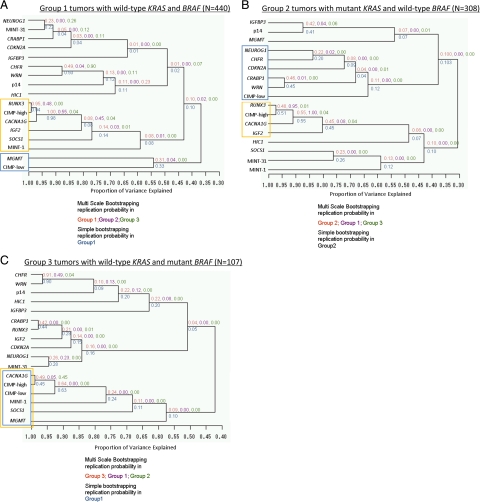
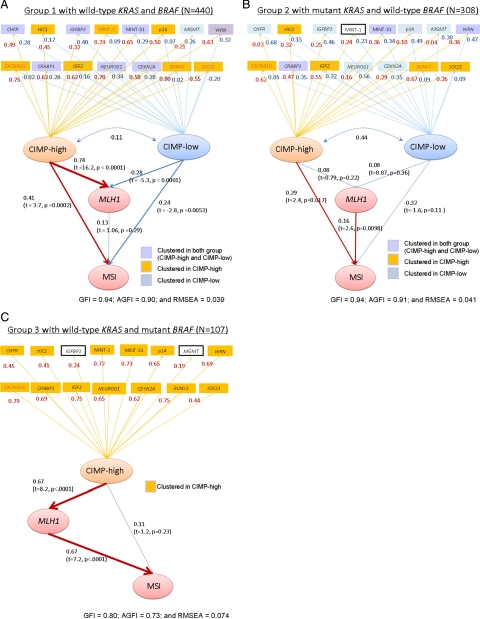
The CpG island methylator phenotype (CIMP-high, CIMP1) is a distinct phenotype associated with microsatellite instability (MSI) and BRAF mutation in colon cancer. Recent evidence suggests the presence of KRAS mutation-associated CIMP subtype (CIMP-low, CIMP2). We used cluster analysis, principal component analysis (PCA), and structural equation modeling (SEM), a novel strategy, to decipher the correlation structure of CpG island hypermethylation. Using a database of 861 colon and rectal cancers, DNA methylation at 16 CpG islands [CACNA1G, CDKN2A (p16/ink4a), CHFR, CRABP1, HIC1, IGF2, IGFBP3, MGMT, MINT-1, MINT-31, MLH1, NEUROG1, p14 (CDKN2A/arf), RUNX3, SOCS1, and WRN] was quantified by real-time PCR. Tumors were categorized into three groups: Group 1 with wild-type KRAS/BRAF (N = 440); Group 2 with mutant KRAS and wild-type BRAF (N = 308); and Group 3 with wild-type KRAS and mutant BRAF (N = 107). Tumors with mutant KRAS/BRAF (N = 6) were excluded. In unsupervised hierarchical clustering analysis, all but six markers (CACNA1G, IGF2, RUNX3, MGMT, MINT-1, and SOCS1) were differentially clustered with CIMP-high and CIMP-low according to KRAS and BRAF status. In SEM, the correlation structures between CIMP, locus-specific CpG island methylation, and MSI differed according to KRAS and BRAF status, which was consistent with PCA results. In conclusion, KRAS and BRAF mutations appear to differentially influence correlation structure of CpG island methylation. Our novel data suggest two distinct perturbations, resulting in differential locus-specific propensity of CpG methylation.
Figures
References
-
- Teodoridis JM, Hardie C, Brown R. CpG island methylator phenotype (CIMP) in cancer: causes and implications. Cancer Lett. 2008;268:177–186. - PubMed
-
- Weisenberger DJ, Siegmund KD, Campan M, Young J, Long TI, Faasse MA, Kang GH, Widschwendter M, Weener D, Buchanan D, Koh H, Simms L, Barker M, Leggett B, Levine J, Kim M, French AJ, Thibodeau SN, Jass J, Haile R, Laird PW. CpG island methylator phenotype underlies sporadic microsatellite instability and is tightly associated with BRAF mutation in colorectal cancer. Nat Genet. 2006;38:787–793. - PubMed
-
- Nosho K, Irahara N, Shima K, Kure S, Kirkner GJ, Schernhammer ES, Hazra A, Hunter DJ, Quackenbush J, Spiegelman D, Giovannucci EL, Fuchs CS, Ogino S. Comprehensive biostatistical analysis of CpG island methylator phenotype in colorectal cancer using a large population-based sample. PLoS ONE. 2008;3:e3698. - PMC - PubMed
-
- Samowitz W, Albertsen H, Herrick J, Levin TR, Sweeney C, Murtaugh MA, Wolff RK, Slattery ML. Evaluation of a large, population-based sample supports a CpG island methylator phenotype in colon cancer. Gastroenterology. 2005;129:837–845. - PubMed
Publication types
MeSH terms
Substances
Grants and funding
LinkOut - more resources
Full Text Sources
Medical
Research Materials
Miscellaneous
