. 2011 Jan 20;117(3):839-47.
doi: 10.1182/blood-2010-05-287607. Epub 2010 Oct 29.

Hematopoietic differentiation of induced pluripotent stem cells from patients with mucopolysaccharidosis type I (Hurler syndrome)

Affiliations

Hematopoietic differentiation of induced pluripotent stem cells from patients with mucopolysaccharidosis type I (Hurler syndrome)

Jakub Tolar et al. Blood. .

Abstract

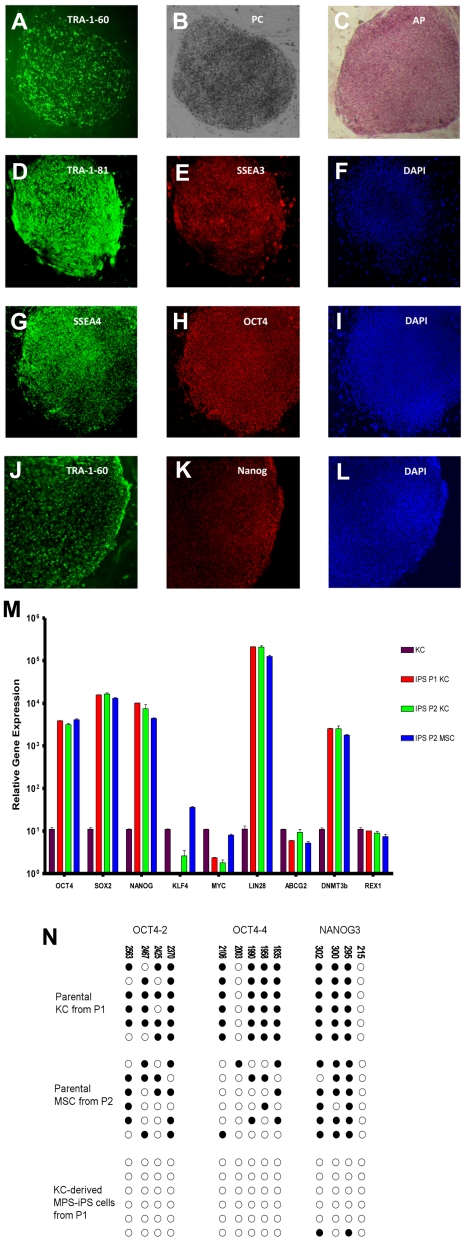
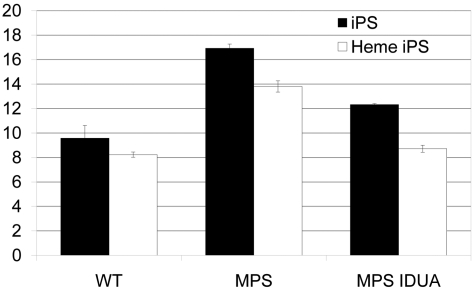
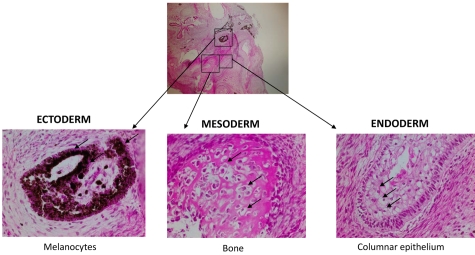
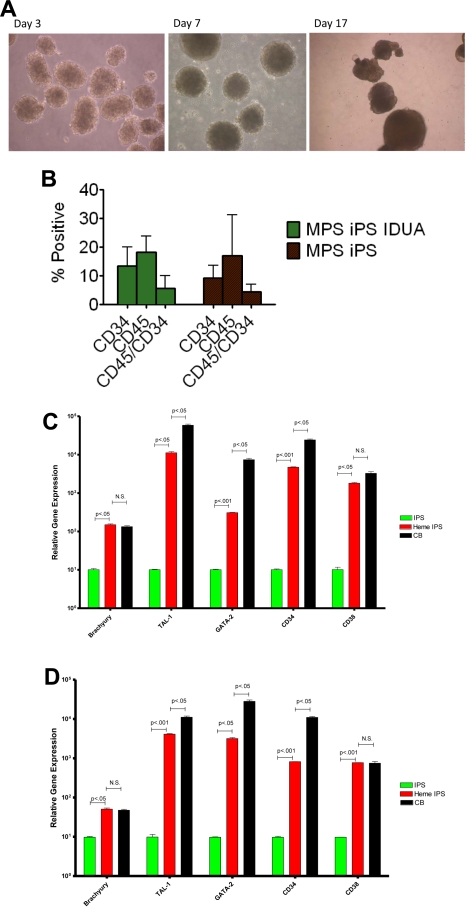
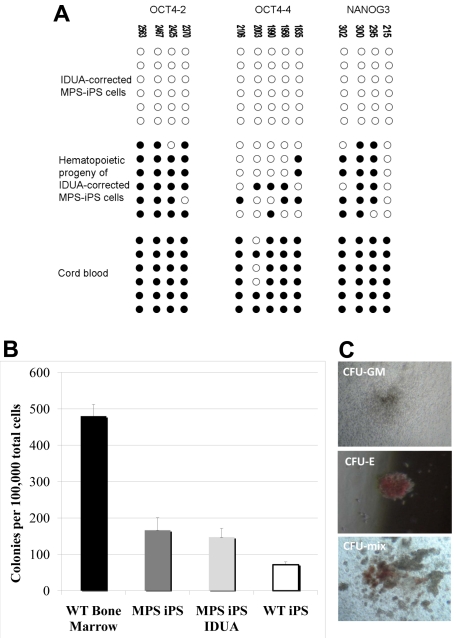
Mucopolysaccharidosis type I (MPS IH; Hurler syndrome) is a congenital deficiency of α-L-iduronidase, leading to lysosomal storage of glycosaminoglycans that is ultimately fatal following an insidious onset after birth. Hematopoietic cell transplantation (HCT) is a life-saving measure in MPS IH. However, because a suitable hematopoietic donor is not found for everyone, because HCT is associated with significant morbidity and mortality, and because there is no known benefit of immune reaction between the host and the donor cells in MPS IH, gene-corrected autologous stem cells may be the ideal graft for HCT. Thus, we generated induced pluripotent stem cells from 2 patients with MPS IH (MPS-iPS cells). We found that α-L-iduronidase was not required for stem cell renewal, and that MPS-iPS cells showed lysosomal storage characteristic of MPS IH and could be differentiated to both hematopoietic and nonhematopoietic cells. The specific epigenetic profile associated with de-differentiation of MPS IH fibroblasts into MPS-iPS cells was maintained when MPS-iPS cells are gene-corrected with virally delivered α-L-iduronidase. These data underscore the potential of MPS-iPS cells to generate autologous hematopoietic grafts devoid of immunologic complications of allogeneic transplantation, as well as generating nonhematopoietic cells with the potential to treat anatomical sites not fully corrected with HCT.


Figures

Figure 1
Figure 1
Induction of MPS IH somatic cells into MPS-iPS cells. (A) Live culture stained with TRA-1-60 antibody 4 weeks after transduction. (B) Phase contrast (PC) image of the same human ES cell-like colony. To confirm their ability to express ES cell proteins, human KCs derived from P1 were stained with alkaline phosphatase (C) and immunostained with TRA-1-81 (D), SSEA-3 (E), SSEA-4 (G), OCT4 (H), TRA-1-60 (J), and Nanog (K). Corresponding images stained with 4,6-diamidino-2-phenylindole (DAPI) show nuclei of individual cells in the colonies (F,I,L). Images in panels A-C were obtained with a Leica DMIL scope, magnification 10×/0.22. Images were acquired with an Optronics camera and Optronics MagnaFire software. Fluorescein isothiocyanate color block was used. Images in panels D-L were obtained with an Olympus BX61 FV500 Confocal Microscope, magnification 10×/.40. Argon, green HeNe, and blue diode lasers were used to acquire the images in Olympus FluoView software Version 4.3. All images were taken at room temperature. (M) Quantitative reverse transcription PCR analysis of OCT4, SOX2, NANOG, KLF4, c-MYC, LIN28, ABCG2, DNMT3b, and REX1 expression levels in KC-derived iPS cells from P1 (red bars), KC-derived iPS cells from P2 (green bars), and MSC-derived iPS cells from P2 (blue bars), respectively. All values were normalized against endogenous GAPDH expression. Because MPS-KCs and MPS-MSCs expressed statistically indistinguishable levels of these ES cell marker genes, their values were plotted against expression levels of parental MPS-KCs from P1 (black bars). (N) Bisulfite sequencing of the OCT4 and NANOG promoters in parental MPS-KCs (from P1), parental MPS-MSCs (from P2), and MPS-iPS cells derived from KCs in P1. Open circles denote unmethylated CpGs, and filled circles represent methylated CpGs. CpG position relative to the downstream transcriptional start site is shown above each column. Sequencing reactions of specific amplicons are represented by each row of circles. KC indicates keratinocytes; MSC, mesenchymal stromal cells; iPS cells, induced pluripotent cells; P, patient; MPS IH, mucopolysaccharidosis type I, Hurler syndrome.
Figure 2
Figure 2
Accumulation of GAG in MPS IH iPS cells. GAGs, normalized to genomic DNA, were significantly higher in both MPS IH cell types: MPS IH iPS cells vs wild-type iPS cells (mean ± SEM, 16.9 ± 0.4 vs 9.6 ± 1.0; P < .02); and MPS IH heme iPS vs wild-type heme iPS (13.8 ± 0.5 vs 8.2 ± 0.2; P < 0.01). GAG levels in gene-correlated cells were significantly lower in both cell types: MPS IH iPS cells vs MPS IH IDUA iPS cells (mean ± SEM, 12.3 ±0.1; P < .01); and MPS IH heme iPS cells vs MPS IH IDUA heme iPS cells (8.7 ± 0.3; P < .01). When GAG levels of gene-corrected cells were compared to that of wild-type cells, no significant difference was found. These data are the results of 3 independent measurements for each cell type and genotype. GAG indicates glycosaminoglycan; iPS, induced pluripotent stem cells; Heme iPS, iPS cell-derived hematopoietic cells; WT, wild type; and MPS, mucopolysaccharidosis type I, Hurler syndrome.
Figure 3
Figure 3
Nonhematopoietic differentiation of MPS-iPS cells. Same histologic section of mature teratoma from immunodeficient mouse injected with MPS-iPS cells (top, magnification 4×) shows melanocytes of ectodermal origin (bottom left arrows), osteoid deposition and osteocytes of medodermal origin (bottom middle arrows), columnar epithelium of endodermal origin (bottom right; goblet cells are indicated by arrows; magnification 20×). Similar mature teratomas with contribution of ectodermal, mesodermal, and endodermal-derived cells formed after injection of early (< 20) passage and late (> 20) passage iPS cells from wild-type keratinocytes and MSCs (n = 11), from patient 1 (keratinocyte-derived iPS cells, n = 3; IDUA-corrected keratinocyte-derived iPS cells, n = 3) and from patient 2 (keratinocyte-derived iPS cells, n = 2; MSC-derived iPS cells, n = 2; data not shown). Hematoxylin-eosin stain. Images were obtained with an Olympus BX51 Microscope, magnification 4×/0.16 and 20×/0.70. Spot RT camera and Spot RT software v3.2 were used in acquiring the images. All images were taken at room temperature.
Figure 4
Figure 4
Hematopoietic differentiation of MPS-iPS cells. (A) Embryoid bodies were derived from iPS cells and induced to differentiate into hematopoietic cells. (B) Cells were harvested and assayed for expression of hematopoietic markers CD45 and CD34. No statistically significant differences were found when hematopoietic progeny of the MPS-iPS cells and gene-corrected MPS-iPS (MPS iPS IDUA) cells were compared as determined by CD34 expression (mean ± SEM, 9.2 ± 1.4 vs 13.5 ± 2.5), CD45 expression (17.0 ± 4.5 vs 18.2 ± 2.1), and simultaneous expression of CD34 and CD45 (4.5 ± 0.8 vs 5.7 ± 1.6; all P > .05). These data did not differ significantly from the CD34 and CD45 expression of the hematopoietic progeny of wild-type iPS cells and in iPS cells of any genotype at early (< 20) passage and late (> 20) passage iPS (data not shown). (C) Quantitative PCR analysis of BRACHYURY, TAL-1, GATA-2, CD34, and CD38 expression levels in wild-type iPS cells (IPS, green bars), hematopoietic progeny of wild-type iPS cells (heme IPS, red bars). and CD34+ cord blood cells (CB; black bars). (D) Quantitative PCR analysis of the same gene set in the MPS-iPS cells (IPS, green bars), hematopoietic progeny of gene-corrected MPS- iPS cells (Heme IPS, red bars), and CD34+ CB cells (black bars). Expression of all these genes in iPS cells of both wild-type and mutant genotype (each set arbitrarily to equal 101) was significantly elevated after induction of hematopoietic differentiation mirroring expression of these genes in hematopoietic progenitor cells derived from human CB. All values were normalized against endogenous GAPDH expression. (A) Images were obtained with a Nikon Eclipse TS100 scope, magnification 10×/0.25. Images were taken with a Nikon Coolpix 4300 digital camera with a microscope adaptor from Martin Microscope MMCOOL S/N:1228 Nikon UR-E4. All images were taken at room temperature.
Figure 5
Figure 5
Methylation patterns and hematopoietic phenotypes of gene-corrected MPS-IPS and their hematopoietic progeny. (A) Bisulfite sequencing of the OCT4 and NANOG promoters in gene-corrected KC-derived MPS-iPS cells from P1, their hematopoietic progeny, and human umbilical cord blood cells. Open circles denote unmethylated CpGs, and filled circles represent methylated CpGs. CpG position relative to the downstream transcriptional start site is shown above each column. Sequencing reactions of specific amplicons are represented by each row of circles. (B) When plated in semisolid methylcellulose medium (100 000 total unsorted cells per experiment), colony-forming units (CFUs) formed. CFUs from iPS-derived hematopoietic cells were compared with wild-type bone marrow cells (6 independent experiments were performed, mean ± SEM, 480 ± 32). Wild-type (WT) bone marrow cells formed significantly more colonies than hematopoietic derivatives of WT iPS cells, MPS-iPS cells, and gene-corrected MPS-iPS cells (all P < .01). There was no significant difference, however, among the number of CFUs from uncorrected MPS-iPS–derived hematopoietic cells (MPS iPS, 12 experiments were performed), corrected MPS-iPS–derived hematopoietic cells (MPS iPS IDUA, 10 experiments), and the WT iPS-derived hematopoietic cells (WT iPS, 6 experiments): 166 ± 34 versus 147 ± 24 versus 71 ± 8; all P > .05. (C) The examples of granulocyte/macrophage CFU (CFU-GM), erythroid CFU (CFU-E), and mixed CFU (CFU-mix) are shown. (C) Images were taken with an Olympus CK2 microscope, magnification 4× EA4 0.10 160/−. Images were taken with a Nikon Coolpix 4300 digital camera with a microscope adaptor from Martin Microscope MMCOOL S/N:1228 Nikon UR-E4. All images were taken at room temperature.

Similar articles

Cited by

References

    1. Fratantoni JC, Hall CW, Neufeld EF. Hurler and Hunter syndromes: mutual correction of the defect in cultured fibroblasts. Science. 1968;162(853):570–572. - PubMed
    1. Hobbs JR, Hugh-Jones K, Barrett AJ, et al. Reversal of clinical features of Hurler's disease and biochemical improvement after treatment by bone-marrow transplantation. Lancet. 1981;2(8249):709–712. - PubMed
    1. Orchard PJ, Blazar BR, Wagner J, Charnas L, Krivit W, Tolar J. Hematopoietic cell therapy for metabolic disease. J Pediatr. 2007;151(4):340–346. - PubMed
    1. Kakkis ED, Muenzer J, Tiller GE, et al. Enzyme-replacement therapy in mucopolysaccharidosis I. N Engl J Med. 2001;344(3):182–188. - PubMed
    1. Krivit W, Sung JH, Shapiro EG, Lockman LA. Microglia: the effector cell for reconstitution of the central nervous system following bone marrow transplantation for lysosomal and peroxisomal storage diseases. Cell Transplant. 1995;4(4):385–392. - PubMed

Publication types

MeSH terms