. 2010 Dec 1;185(11):6947-59.
doi: 10.4049/jimmunol.1001269. Epub 2010 Oct 29.

IL-17 regulates adipogenesis, glucose homeostasis, and obesity

Affiliations

IL-17 regulates adipogenesis, glucose homeostasis, and obesity

Luis A Zúñiga et al. J Immunol. .

Erratum in

  • J Immunol. 2011 Jan 15;186(2):1291

Abstract

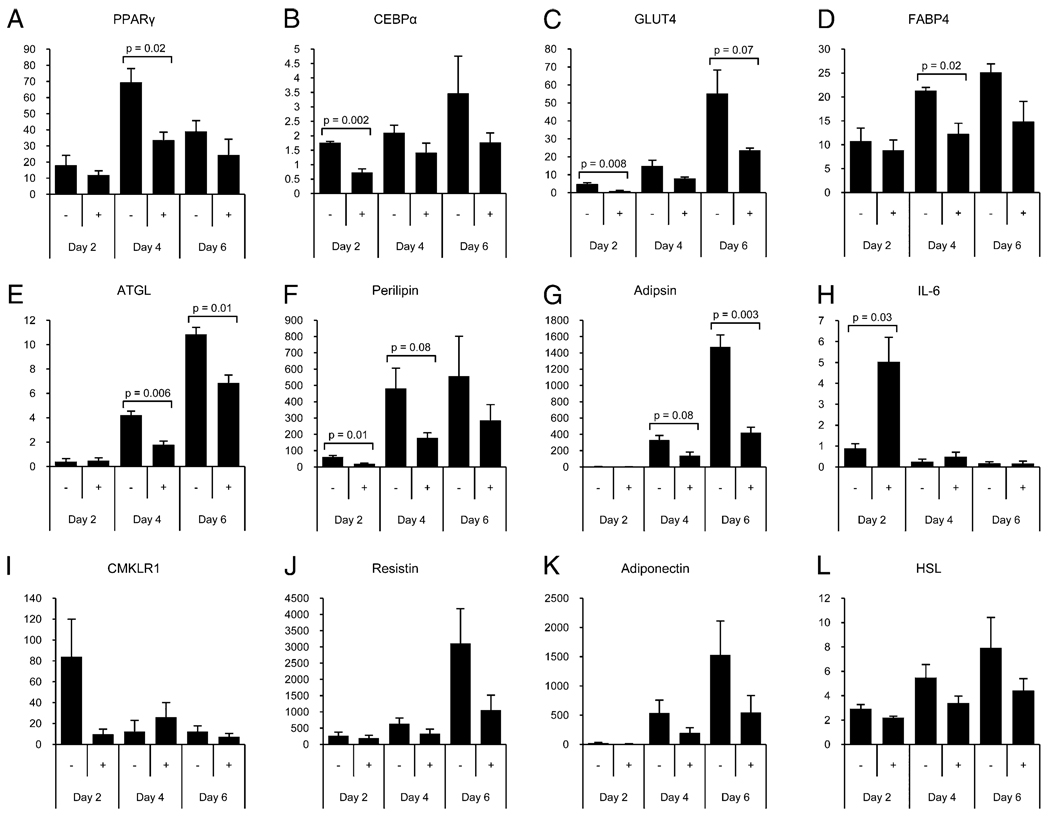
Inflammatory mediators have the potential to impact a surprising range of diseases, including obesity and its associated metabolic syndrome. In this paper, we show that the proinflammatory cytokine IL-17 inhibits adipogenesis, moderates adipose tissue (AT) accumulation, and regulates glucose metabolism in mice. IL-17 deficiency enhances diet-induced obesity in mice and accelerates AT accumulation even in mice fed a low-fat diet. In addition to potential systemic effects, IL-17 is expressed locally in AT by leukocytes, predominantly by γδ T cells. IL-17 suppresses adipocyte differentiation from mouse-derived 3T3-L1 preadipocytes in vitro, and inhibits expression of genes encoding proadipogenic transcription factors, adipokines, and molecules involved in lipid and glucose metabolism. IL-17 also acts on differentiated adipocytes, impairing glucose uptake, and young IL-17-deficient mice show enhanced glucose tolerance and insulin sensitivity. Our findings implicate IL-17 as a negative regulator of adipogenesis and glucose metabolism in mice, and show that it delays the development of obesity.


Conflict of interest statement

Disclosures

B.J.-S. and D.J.C. are employees of MERCK. All other authors have no financial conflicts of interest.

Figures

FIGURE 1
FIGURE 1
IL-17 expression by AT leukocyte subsets. A–C, Leukocytes were isolated from spleen, ILN, inguinal (Ing.) AT, and epididymal (Epi.) AT from male mice fed an HF diet for 18 wk. Cells were stimulated with PMA and ionomycin for 4 h in the presence of brefeldin A. Intracellular expression of IL-17 and IFN-γ was assessed on the indicated T cell subsets, defined by staining for CD3, CD4, CD8, and γδ TCR. A, Evaluation of CD3 and IL-17 expression by tissue leukocytes. B, Expression of γδ TCR, CD4, or CD8 by CD3+IL-17+ cells gated in A. C, Stimulated expression of IL-17 and IFN-γ by various tissue T cell subsets. D and E, Evaluation of spontaneous IL-17 expression: Cells were isolated from male mice fed a HF diet for 16–18 wk (D) or 12 mo (E) and were cultured for 8–16 h in medium supplemented with brefeldin A without exogenous stimulation, followed by intracellular staining for IL-17. Data are representative of two to five experiments with similar results.
FIGURE 2
FIGURE 2
Diet-induced differences in IL-17 expression by tissue T cell subsets. Six-wk-old male C57BL/6NCr mice were fed a LF (10% fat) or HF (60% fat) diet for 3 mo. Spleen, ILN, inguinal (Ing.) AT, and epididymal (Epi.) AT were harvested; AT was weighed; and tissue cells were analyzed for T cell content and stimulated intracellular IL-17 as in Fig. 1. Five mice per group were analyzed, and mean values are given with SEM. A, Percentage of tissue CD3+ T cells expressing IL-17. *p < 0.003 versus LF Ing. AT; **p < 0.04 versus HF Epi. AT; Holm–Sidak multiple-comparison test. The mean representation of CD4, CD8, and γδ T cells among the IL-17–expressing pool is indicated within the bars. B, Frequency of IL-17+ cells of the indicated phenotype, expressed as a percentage of the total CD3+ T cell pool. γδ: *p < 0.004 versus LF Ing. AT; **p < 0.04 versus HF Epi. AT; CD4: *p < 0.001; Holm–Sidak multiple comparison test. C, Number of recovered IL-17+ cells of the indicated T cell phenotype per gram AT. γδ: *p < 0.02 versus LF Ing. AT; CD4: *p < 0.001 versus LF Ing. AT; Student t test. Data are from individual experiments and are representative of three experiments with similar results.
FIGURE 3
FIGURE 3
Enhanced susceptibility of IL-17 KO mice to dietary obesity. Six- to 7-wk-old IL-17 WT (n = 25–30 per group) and IL-17 KO (n = 14–26 per group) male mice were fed an LF (10% fat) (A) or HF (60% fat) (B) diet and their weights were measured over time. Data are pooled from three independent experiments, each consisting of 4–10 mice per group, and are presented as mean body mass ± SEM. *p < 0.05 between IL-17 WT and KO groups at the indicated time points; Student t test. Mice from A and B were analyzed for body AT mass (C) and lean mass (D) content by DEXA after 3 mo of feeding. Results are expressed as mean tissue mass ± SEM. Significance was determined using Student t test, and p values are represented between IL-17 WT and KO groups. Data for C and D are from a single experiment and are representative of three individual experiments with similar results.
FIGURE 4
FIGURE 4
IL-17 inhibits adipogenesis in 3T3-L1 preadipocytes. A, Expression of IL-17RA mRNA in AT. Primary inguinal adipose depot adipocyte RNA was isolated and assayed for IL-17RA expression via RT-PCR. Escherichia coli RNA used as a negative control and mouse embryonic fibroblast (MEF) RNA as a positive control. Genomic DNA contamination was assessed in samples without reverse transcriptase added (No RT). B, IL-17 activates signaling pathways in preadipocytes. Confluent, 4- to 8-h serum-starved 3T3-L1 preadipocytes were treated with 100 ng/ml IL-17 for times indicated before being harvested for protein. Phosphorylated and total ERK and AKT were detected by Western blot analysis. C and D, IL-17 treatment during preadipocyte differentiation inhibits lipid accumulation. Day 0 3T3-L1 preadipocytes were treated with differentiation media with or without IL-17 for 2 d. Day 2 media was replaced with lipid-loading media supplemented with insulin only and incubated for 2 d. Finally, day 4 media was replaced with lipid-loading media only and allowed to load lipid for an additional 2 (C) or 6 days (D). C, Two-day lipid-loaded cells were treated with hexane to extract total lipid and assayed for triglyceride (TG) and protein content (n = 6 replicates). Undifferentiated (Undiff) 3T3-L1 cells were grown alongside differentiated cells and are included for comparison. TG data are represented as milligram TG per milligram protein ± SEM. *p < 0.02 versus indicated conditions; Holm–Sidak multiple-comparison test. Data are representative of five independent experiments. D, Six-day postinduction lipid-loaded cells were treated with formalin and stained with oil red O. Representative images for each condition are shown. Cells were photographed at ×100 magnification. E, 3T3-L1 preadipocyte proliferative response to IL-17. Day 0 3T3-L1 preadipocytes were treated with differentiation media with or without IL-17 for 24 h and assessed for [3H]thymidine incorporation (n = 6 replicates). Data are presented as mean counts per minute ± SEM (p < 0.001 versus all other conditions). Data are representative of two independent experiments.
FIGURE 5
FIGURE 5
IL-17 inhibits induction of adipocyte genes. On day 0, 3T3-L1 preadipocytes were treated with differentiation media with (+) or without (−) 100 ng/ml IL-17 for 2 d (day 2 samples). Media were then replaced with lipid-loading media supplemented with insulin only and incubated for 2 d (day 4 samples). Finally, on day 4, media were replaced with lipid-loading media only and allowed to load lipid for 2 more days (day 6). RNA was isolated, for qPCR analysis, either 2, 4, or 6 d after differentiation media were added. Ct values were normalized to ubiquitin B values within each sample. To allow pooling of data from different experiments, we then normalized results for each gene to values from 5-d postconfluent undifferentiated 3T3-L1 control cells (included in each experiment). Results are presented as mean gene expression relative to undifferentiated control cells from three independent experiments ± SEM. Significance was determined using Student t test, and p values are represented between IL-17–treated and untreated conditions. ATGL, adipose tissue triglyceride lipase; FABP4, fatty acid binding protein 4; GLUT4, glucose transporter-4.
FIGURE 6
FIGURE 6
IL-17 inhibits glucose uptake in vitro and improves metabolic parameters before the onset of obesity. A, In vitro glucose uptake: mature 3T3-L1 adipocytes were allowed to load lipid for 10–14 d. Cells were serum starved for 4 h, then washed and switched to glucose-free media with or without 100 ng/ml IL-17 for 1 h. Insulin, 1 µM, was added to some wells, as indicated, for 15 min before adding [3H]deoxyglucose. After 15-min additional incubation, cells were washed and assayed for radiolabeled deoxyglucose content. Results are expressed as mean dpm ± SEM. *p < 0.03 versus basal; **p < 0.001 versus all other treatments; Holm–Sidak multiple-comparison test. B and C, In vivo glucose and insulin challenge. Ten-week-old LF diet-fed IL-17 WT (open circles; n = 9–10) and KO (closed circles; n = 9) male mice were fasted for 6 h and injected i.p. with either 1.5 g glucose/kg body weight (B) or 1 U insulin/kg body weight (C). Blood glucose was measured before and after injection at the times indicated. Results are expressed as mean percentage initial glucose ± SEM. *p < 0.05 between IL-17 WT and KO groups at indicated time points; Student t test. Insets represent basal (fasting) glucose levels for each assay, expressed as mean total glucose (mg/dl) ± SEM (*p < 0.04 versus KO; Student t test). D–G, 10-wk-old LF-fed IL-17 WT (n = 9–10) and KO (n = 9) male mice were fasted for 6 h, and serum was collected and assayed for insulin (D), IL-6 (E), adiponectin (F), and leptin (G). Results are expressed as mean analyte concentration ± SEM. *p < 0.05 versus KO; **p < 0.03 versus KO; Student t test. Data are from individual experiments and are representative of three experiments with similar results.
FIGURE 7
FIGURE 7
Obesity with age reverses protection from metabolic syndrome conferred by IL-17 deficiency. A and C, IL-17 WT (closed circles; n = 5 per group) and KO (open circles; n = 4–5 per group) mice fed a LF or a HF diet for 14–18 wk were fasted for 18 h and injected i.p. with 1 g glucose/kg body weight (A) or were fasted for 6 h and injected i.p. with 1 U insulin/kg body weight (C). Blood glucose was measured before and after injection at the indicated time points. Results are expressed as mean percentage initial glucose ± SEM. *p < 0.05 between IL-17 WT and KO groups at indicated time points. Fasting blood glucose for the GTT (B) and ITT (D) are represented as mean total glucose (mg/ml) ± SEM. *p < 0.05 versus all other conditions; Holm–Sidak multiple-comparison test. E, Body mass from mice described in A–D. Results are expressed as mean body mass ± SEM (Student t test). Data are from individual experiments and are representative of two experiments with similar results.
FIGURE 8
FIGURE 8
Evaluation of diet-induced obesity, glucose tolerance, insulin tolerance, and AT leukocyte cytokine expression in γδ T cell-deficient mice. A, Six- to 8-wk-old C57BL/6J WT (n = 5 per group) and TCRδ KO (n = 5 per group) male mice were fed an HF (60% fat) diet, and their weights were measured over time. Results are expressed as mean body mass ± SEM. B and C, In vivo glucose and insulin challenge, respectively. Eight- to 10-wk-old C57BL/6J WT (open circles; n = 5 per group) and TCRδ KO (closed circles; n = 5 per group) male mice were fed a 60% fat diet. Mice were fasted for 6 h and injected i.p. with either 1.5 g glucose/kg body weight (B) or 1 U insulin/kg body weight (C). Blood glucose was measured before and after injection at the times indicated. Results are expressed as mean percentage initial glucose ± SEM. *p < 0.05 between WT and KO groups at indicated time points; Student t test. Insets represent basal (fasting) glucose levels for each assay, expressed as mean total glucose (mg/dl) ± SEM. *p < 0.04 versus KO; Student t test. D and E, Leukocytes were isolated from inguinal (Ing.) or epididymal (Epi.) AT from C57BL/ 6J WT (n = 4–5 per group) and TCRδ KO (γδ KO; n = 4–5 per group) male mice fed an HF diet for 16–20 wk. Cells were stimulated with PMA and ionomycin for 4 h in the presence of brefeldin A. Intracellular expression of IL-17 was assessed on the indicated T cell subsets, defined by staining for CD3, CD4, CD8, NK1.1, β TCR, and γδ TCR. D, IL-17+ T cells from the epididymal AT of WT and TCRδ KO animals were evaluated for expression of β-TCR, γδ TCR, CD4, and CD8. IL-17+ events are represented in black, whereas total CD3+ T cells are represented in gray. Isotype control staining for IL-17 is shown for comparison with anti–IL-17. E, Total IL-17–expressing T cell load in AT expressed as mean total IL-17+ T cells per gram AT ± SEM (n = 4–5 per group). Columns also indicate the contribution of specific IL-17+ T cell subsets per gram of AT, as indicated.

References

    1. Olufadi R, Byrne CD. Clinical and laboratory diagnosis of the metabolic syndrome. J. Clin. Pathol. 2008;61:697–706. - PubMed
    1. Fajas L. Adipogenesis: a cross-talk between cell proliferation and cell differentiation. Ann. Med. 2003;35:79–85. - PubMed
    1. Fève B. Adipogenesis: cellular and molecular aspects. Best Pract. Res. Clin. Endocrinol. Metab. 2005;19:483–499. - PubMed
    1. Lago F, Dieguez C, Gómez-Reino J, Gualillo O. Adipokines as emerging mediators of immune response and inflammation. Nat. Clin. Pract. Rheumatol. 2007;3:716–724. - PubMed
    1. Goralski KB, McCarthy TC, Hanniman EA, Zabel BA, Butcher EC, Parlee SD, Muruganandan S, Sinal CJ. Chemerin, a novel adipokine that regulates adipogenesis and adipocyte metabolism. J. Biol. Chem. 2007;282:28175–28188. - PubMed

Publication types

MeSH terms