Phosphoryl moieties of lipid A from Neisseria meningitidis and N. gonorrhoeae lipooligosaccharides play an important role in activation of both MyD88- and TRIF-dependent TLR4-MD-2 signaling pathways
- PMID: 21037101
- PMCID: PMC3059745
- DOI: 10.4049/jimmunol.1000953
Phosphoryl moieties of lipid A from Neisseria meningitidis and N. gonorrhoeae lipooligosaccharides play an important role in activation of both MyD88- and TRIF-dependent TLR4-MD-2 signaling pathways
Abstract
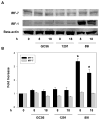
We have previously shown that the lipooligosaccharide (LOS) from Neisseria meningitidis and N. gonorrhoeae engages the TLR4-MD-2 complex. In this study, we report that LOS from different meningococcal and gonococcal strains have different potencies to activate NF-κB through TLR4-MD-2 and that the relative activation can be correlated with ion abundances in MALDI-TOF mass spectrometry that are indicative of the number of phosphoryl substituents on the lipid A (LA) component of the LOS. The LOSs from three of the strains, meningococcal strain 89I and gonococcal strains 1291 and GC56, representing high, intermediate, and low potency on NF-κB activation, respectively, differently activated cytokine expression through the TLR4-MD-2 pathway in monocytes. In addition to induction of typical inflammatory cytokines such as TNF-α, IL-1β, and IL-6, MIP-1α and MIP-1β also were significantly higher in cells treated with 89I LOS, which had the most phosphoryl substitutions on the LA compared with 1291 LOS and GC56 LOS. We found that LOS activated both the MyD88- and TRIF-dependent pathways through NF-κB and IFN regulatory factor 3 transcription factors, respectively. Moreover, LOS induced the expression of costimulatory molecule CD80 on the surfaces of monocytes via upregulation of IFN regulatory factor 1. These results suggest that phosphoryl moieties of LA from N. meningitidis and N. gonorrhoeae LOSs play an important role in activation of both the MyD88- and TRIF-dependent pathways. Our findings are consistent with the concept that bacteria modulate pathogen-associated molecular patterns by expression of phosphoryl moieties on the LA to optimize interactions with the host.
Figures


Similar articles
-
Induction of endotoxin tolerance by pathogenic Neisseria is correlated with the inflammatory potential of lipooligosaccharides and regulated by microRNA-146a.J Immunol. 2014 Feb 15;192(4):1768-77. doi: 10.4049/jimmunol.1301648. Epub 2014 Jan 17. J Immunol. 2014. PMID: 24442429
-
Endotoxin tolerance dysregulates MyD88- and Toll/IL-1R domain-containing adapter inducing IFN-beta-dependent pathways and increases expression of negative regulators of TLR signaling.J Leukoc Biol. 2009 Oct;86(4):863-75. doi: 10.1189/jlb.0309189. Epub 2009 Aug 5. J Leukoc Biol. 2009. PMID: 19656901 Free PMC article.
-
Role for MyD88-independent, TRIF pathway in lipid A/TLR4-induced endotoxin tolerance.J Immunol. 2007 Sep 15;179(6):4083-92. doi: 10.4049/jimmunol.179.6.4083. J Immunol. 2007. PMID: 17785847
-
Differential induction of the toll-like receptor 4-MyD88-dependent and -independent signaling pathways by endotoxins.Infect Immun. 2005 May;73(5):2940-50. doi: 10.1128/IAI.73.5.2940-2950.2005. Infect Immun. 2005. PMID: 15845500 Free PMC article.
-
The Asp299Gly polymorphism alters TLR4 signaling by interfering with recruitment of MyD88 and TRIF.J Immunol. 2012 May 1;188(9):4506-15. doi: 10.4049/jimmunol.1200202. Epub 2012 Apr 2. J Immunol. 2012. PMID: 22474023 Free PMC article.
Cited by
-
Phosphoethanolamine decoration of Neisseria gonorrhoeae lipid A plays a dual immunostimulatory and protective role during experimental genital tract infection.Infect Immun. 2014 Jun;82(6):2170-9. doi: 10.1128/IAI.01504-14. Epub 2014 Mar 31. Infect Immun. 2014. PMID: 24686069 Free PMC article.
-
Structure of a lipid A phosphoethanolamine transferase suggests how conformational changes govern substrate binding.Proc Natl Acad Sci U S A. 2017 Feb 28;114(9):2218-2223. doi: 10.1073/pnas.1612927114. Epub 2017 Feb 13. Proc Natl Acad Sci U S A. 2017. PMID: 28193899 Free PMC article.
-
Lack of lipid A pyrophosphorylation and functional lptA reduces inflammation by Neisseria commensals.Infect Immun. 2012 Nov;80(11):4014-26. doi: 10.1128/IAI.00506-12. Epub 2012 Sep 4. Infect Immun. 2012. PMID: 22949553 Free PMC article.
-
Mechanisms of host manipulation by Neisseria gonorrhoeae.Front Microbiol. 2023 Feb 3;14:1119834. doi: 10.3389/fmicb.2023.1119834. eCollection 2023. Front Microbiol. 2023. PMID: 36819065 Free PMC article. Review.
-
Novel Campylobacter concisus lipooligosaccharide is a determinant of inflammatory potential and virulence.J Lipid Res. 2018 Oct;59(10):1893-1905. doi: 10.1194/jlr.M085860. Epub 2018 Jul 26. J Lipid Res. 2018. PMID: 30049709 Free PMC article.
References
-
- Stephens DS. Conquering the meningococcus. FEMS Microbiol Rev. 2007;31:3–14. - PubMed
-
- Soper DE. Pelvic inflammatory disease. Obstet Gynecol. 2010;116:419–428. - PubMed
-
- Farley TA, Cohen DA, Wu SY, Besch CL. The value of screening for sexually transmitted diseases in an HIV clinic. J Acquir Immune Defic Syndr. 2003;33:642–648. - PubMed
-
- Tapsall JW. Neisseria gonorrhoeae and emerging resistance to extended spectrum cephalosporins. Curr Opin Infect Dis. 2009;22:87–91. - PubMed
-
- Lo H, Tang CM, Exley RM. Mechanisms of avoidance of host immunity by Neisseria meningitidis and its effect on vaccine development. Lancet Infect Dis. 2009;9:418–427. - PubMed
Publication types
MeSH terms
Substances
Grants and funding
LinkOut - more resources
Full Text Sources
Research Materials

