. 2010 Oct;22(10):3232-48.
doi: 10.1105/tpc.110.079962. Epub 2010 Oct 29.

Arabidopsis SET DOMAIN GROUP2 is required for H3K4 trimethylation and is crucial for both sporophyte and gametophyte development

Affiliations

Arabidopsis SET DOMAIN GROUP2 is required for H3K4 trimethylation and is crucial for both sporophyte and gametophyte development

Alexandre Berr et al. Plant Cell. 2010 Oct.

Abstract

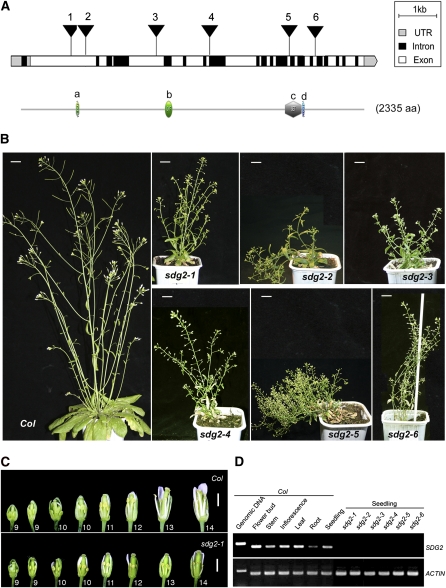
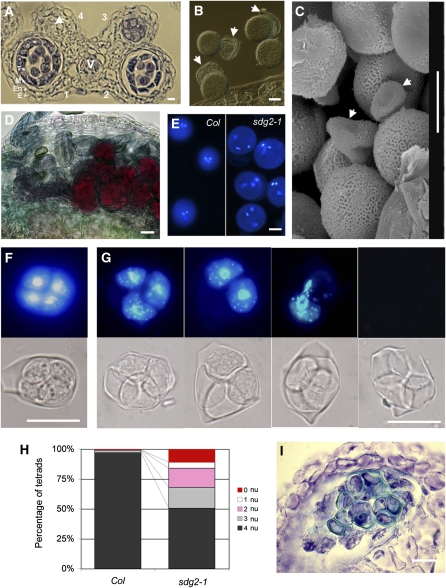
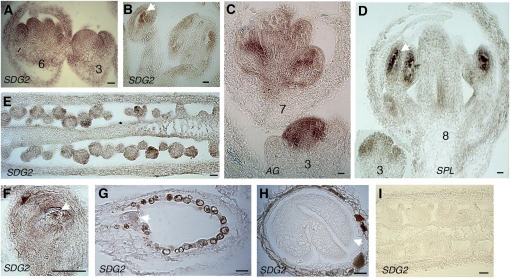
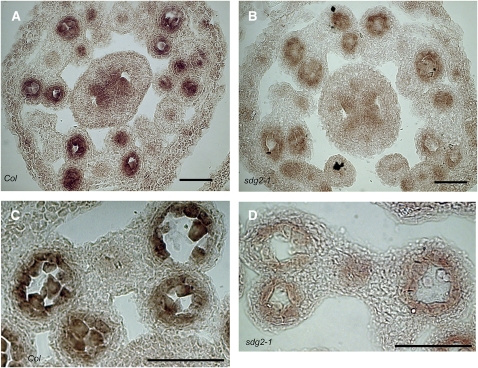
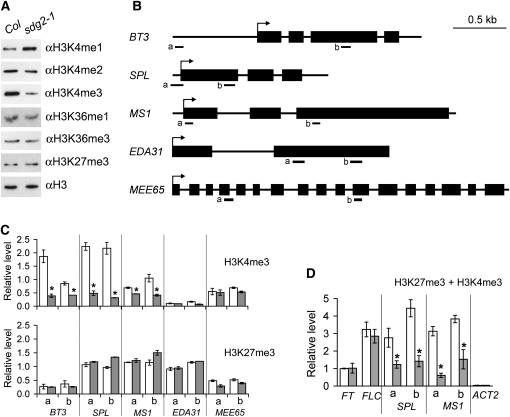
Histone H3 lysine 4 trimethylation (H3K4me3) is abundant in euchromatin and is in general associated with transcriptional activation in eukaryotes. Although some Arabidopsis thaliana SET DOMAIN GROUP (SDG) genes have been previously shown to be involved in H3K4 methylation, they are unlikely to be responsible for global genome-wide deposition of H3K4me3. Most strikingly, sparse knowledge is currently available about the role of histone methylation in gametophyte development. In this study, we show that the previously uncharacterized SDG2 is required for global H3K4me3 deposition and its loss of function causes wide-ranging defects in both sporophyte and gametophyte development. Transcriptome analyses of young flower buds have identified 452 genes downregulated by more than twofold in the sdg2-1 mutant; among them, 11 genes, including SPOROCYTELESS/NOZZLE (SPL/NZZ) and MALE STERILITY1 (MS1), have been previously shown to be essential for male and/or female gametophyte development. We show that both SPL/NZZ and MS1 contain bivalent chromatin domains enriched simultaneously with the transcriptionally active mark H3K4me3 and the transcriptionally repressive mark H3K27me3 and that SDG2 is specifically required for the H3K4me3 deposition. Our data suggest that SDG2-mediated H3K4me3 deposition poises SPL/NZZ and MS1 for transcriptional activation, forming a key regulatory mechanism in the gene networks responsible for gametophyte development.


Figures

Figure 1.
Figure 1.
SDG2 Gene Structure, Protein Domains, and Phenotype of Loss-of-Function Mutant Alleles. (A) Exon-intron structure of the SDG2 gene and domain organization of the predicted SDG2 protein. Each triangle indicates T-DNA or transposon insertion site in different mutant alleles: 1, sdg2-1; 2, sdg2-2; 3, sdg2-3; 4, sdg2-4; 5, sdg2-5; and 6, sdg2-6. Different protein domains are as follows: a, NEBULIN domain; b, GYF domain; c, SET domain; d, POST_SET domain. aa, amino acids; UTR, untranslated region. (B) Phenotype comparison of 9-week-old plants between the wild-type Col and different allelic sdg2 mutants. Bars = 2 cm. (C) Comparison of flower development between sdg2-1 and Col. Some sepals and petals have been removed to expose the inner whorl organs. Numbers indicate flower developmental stages according to Smyth et al. (1990). Note that sdg2-1 stamens are shorter than Col stamens. Bars = 1 mm. (D) RT-PCR analysis of SDG2 expression in various Col plant organs and in Col and sdg2 mutant seedlings. ACTIN serves as an internal control.
Figure 2.
Figure 2.
Comparison of Leaf Initiation and Phenotype between the sdg2-1 Mutant and Wild-Type Col. (A) Leaf initiation evaluated by total number of leaves per plant over the time course of plant growth. Mean values from 10 plants are shown, and error bars indicate sd. Arrow indicates age point from which plants start flowering. (B) True leaves dissected from individual plants at 6 weeks old. Bar = 1 cm. (C) Differential interference contrast (DIC) images of mature leaf adaxial epidermal cells from the seventh true leaf of 6-week-old plants. Bars = 100 μm. (D) Relative size of leaf adaxial epidermal pavement cells evaluated by measurement of the cell area from DIC images. The y axis indicates the relative cell size (wild type is set to 100%) calculated from the mean value of 30 cells, and error bars indicate sd. (E) Ploidy levels of cells from leaves of 2-week-old plants. Mean values from two independent experiments are shown. Error bars indicate sd. SDG2-1(+/−) depicts heterozygous plants of the mutant. [See online article for color version of this figure.]
Figure 3.
Figure 3.
sdg2-1 Exhibits Wide-Ranging Defects in Anther and Male Gametophyte Development. (A) Transverse section of sdg2-1 anther. Arabidopsis anthers consist of four locules (numbered on the micrograph). A normal locule, as indicated for locule 1, consists of microsporocytes surrounded by four nonreproductive cell layers, from the interior to the surface: the tapetum (T), the middle layer (M), the endothecium (En), and the epidermis (E). As indicated by the arrow, locule 4 is developmentally arrested, and microsporocytes and the tapetal layer are absent. V indicates vasculature. (B) sdg2-1 pollen grains at anthesis. Arrows indicate collapsed pollen grains. (C) Scanning electron micrograph of sdg2-1 pollen grains. Arrows indicate collapsed pollen grains. (D) Alexander staining of pollen grains within an sdg2-1 locule. Defective pollen is light green, and viable pollen is dark red or pink. (E) Comparison between Col and sdg2-1 DAPI-stained pollen. Each pollen grain contains two densely stained sperm cell nuclei and one larger/more diffuse vegetative cell nucleus. (F) and (G) Col and sdg2-1 tetrad phenotypes, respectively. Top panels show DAPI staining, and bottom panels show corresponding DIC images. Representative images of different mutant phenotypes are shown for sdg2-1. (H) Quantitative analysis of tetrad phenotypes. Percentage of tetrads showing variable number of DAPI-stained nuclei (nu) was calculated from a total of 200 tetrads each for Col and sdg2-1. (I) Transverse section through an sdg2-1 locule showing presence of abnormal tetrads inside. Bars = 10 μm for (A) to (G) and (I).
Figure 4.
Figure 4.
sdg2-1 Shows Severe Defects in Ovule and Female Gametophyte Development. (A) and (B) DIC images of ovule primordia in Col and sdg2-1, respectively. Arrows indicate archesporial/megasporogenous cells. (C) to (E) DIC images of a Col ovule at the two-nucleate embryo sac stage (C) and of sdg2-1 ovules at later developmental stages ([D] and [E]). Note the absence of an obvious embryo sac and the disproportionate nucellus and integument proliferation in sdg2-1 ovules. Arrows indicate a two-nucleate embryo sac in Col (C) and abnormal nucellus (nu), inner integument (ii), and outer integument (oi) in sdg2-1 (D). (F) to (I) Three-dimensional reconstruction images of confocal sections of Col (F) and sdg2-1 ([G] to [I]) mature ovules. In the Col ovule, arrows indicate the following: ch, chalazal region containing three degenerating antipodal cell nuclei; cn, diploid central cell nucleus; en, egg cell nucleus; and sn, two synergic cell nuclei at the micropylar end. In sdg2-1 ovules, arrows indicate the micropylar end with signs of degenerating cells visible as brightly fluorescent abnormal structures. Bars = 10 μm.
Figure 5.
Figure 5.
In Situ Hybridization Analysis of SDG2 Expression. (A) Longitudinal section through two Col flower buds at developmental stages 3 and 6, probed for SDG2. (B) Longitudinal section through Col anthers at flower developmental stage 8, probed for SDG2. Arrow indicates microsporocyte surrounded by tapetum within a locule. (C) Longitudinal section through two Col flower buds at developmental stages 3 and 7, probed for AG. (D) Longitudinal section through two Col flower buds at developmental stages 3 and 8, probed for SPL. Arrow indicates microsporocyte within a locule. (E) Longitudinal section through part of a Col gynoecium at flower developmental stage 11-12, probed for SDG2. (F) Longitudinal section through Col ovule, probed for SDG2. Arrow indicates the embryo sac. (G) and (H) Longitudinal sections through Col seeds at quadrant and bent-cotyledon embryo stages, respectively, probed for SDG2. Arrow indicates embryo. (I) Longitudinal section through part of an sdg2-1 gynoecium at flower developmental stage 11-12, probed for SDG2. Hybridization signals are dark-brown/pink areas. Negative controls using a sense probe did not generate detectable signal. Note that endothelial cells surrounding the embryo are frequently colored, which resembles the hybridization signal. This occurs without application of probe and is caused by plant metabolites. Bars = 10 μm.
Figure 6.
Figure 6.
Quantitative RT-PCR Analysis of Gene Expression in Col and sdg2-1 Flower Buds at Developmental Stage 8. Relative expression levels are calculated from mean values of three replicates from two independent biological samples. Error bars show sd.
Figure 7.
Figure 7.
In Situ Hybridization Analysis of SPL/NZZ Expression in Col and sdg2-1 Floral Organs. (A) and (B) Transverse section through flower bud at developmental stage 7-8 in Col and sdg2-1, respectively. (C) and (D) Transverse section through anther at flower developmental stage 8-9 in Col and sdg2-1, respectively. Bars = 50 μm.
Figure 8.
Figure 8.
Comparison of Histone Methylation in sdg2-1 and Col. (A) Global levels of H3K4, but not H3K36 or H3K27, methylation are perturbed in sdg2-1 compared with Col. Histone-enriched protein extracts from 20-d-old plants were analyzed by protein immunoblots using specific antibodies that recognize different histone methylation forms as indicated. (B) Diagram representing genomic structure and ChIP-examined regions of various genes identified as downregulated in sdg2-1 flower buds. Black boxes represent exons; arrows indicate the ATG start codon sites; bars labeled a or b represent regions amplified by PCR in ChIP analysis. (C) ChIP analysis of H3K4me3 (top graph) and H3K27me3 (bottom graph) deposition at specific genes in Col (white columns) and sdg2-1 (gray columns) flower buds. ChIP samples were analyzed by quantitative PCR on two different regions (a and b) of each gene. Relative levels are calculated from mean values of three replicates; error bars show sd. The asterisk indicates a significant difference between sdg2-1 and Col (P < 0.01). (D) Sequential ChIP analysis for simultaneous presence of H3K27me3 and H3K4me3 at chromatin of specific genes in Col (white columns) and sdg2-1 (gray columns) flower buds. Chromatin was immunoprecipitated sequentially with anti-H3K27me3 and anti-H3K4me3 antibodies. Quantitative PCR analysis was performed and data shown as described in (C). FT and FLC serve as positive controls and ACT2 serves as a negative control.

References

    1. Aarts M.G., Hodge R., Kalantidis K., Florack D., Wilson Z.A., Mulligan B.J., Stiekema W.J., Scott R., Pereira A. (1997). The Arabidopsis MALE STERILITY 2 protein shares similarity with reductases in elongation/condensation complexes. Plant J. 12: 615–623 - PubMed
    1. Alexander M.P. (1969). Differential staining of aborted and nonaborted pollen. Stain Technol. 44: 117–122 - PubMed
    1. Alvarez-Venegas R., Avramova Z. (2005). Methylation patterns of histone H3 Lys 4, Lys 9 and Lys 27 in transcriptionally active and inactive Arabidopsis genes and in atx1 mutants. Nucleic Acids Res. 33: 5199–5207 - PMC - PubMed
    1. Alvarez-Venegas R., Pien S., Sadder M., Witmer X., Grossniklaus U., Avramova Z. (2003). ATX-1, an Arabidopsis homolog of trithorax, activates flower homeotic genes. Curr. Biol. 13: 627–637 - PubMed
    1. Alves-Ferreira M., Wellmer F., Banhara A., Kumar V., Riechmann J.L., Meyerowitz E.M. (2007). Global expression profiling applied to the analysis of Arabidopsis stamen development. Plant Physiol. 145: 747–762 - PMC - PubMed

Publication types

MeSH terms

Associated data