

Interactions between internal forces, body stiffness, and fluid environment in a neuromechanical model of lamprey swimming
- PMID: 21037110
- PMCID: PMC2993357
- DOI: 10.1073/pnas.1011564107
Interactions between internal forces, body stiffness, and fluid environment in a neuromechanical model of lamprey swimming
Abstract
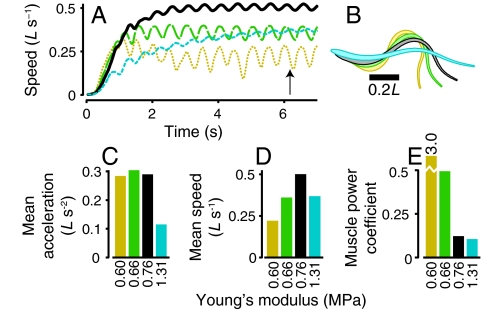
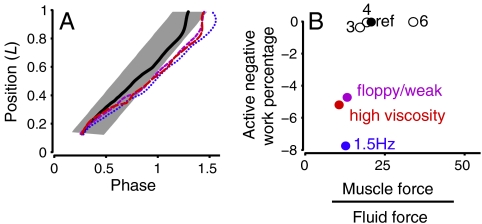
Animal movements result from a complex balance of many different forces. Muscles produce force to move the body; the body has inertial, elastic, and damping properties that may aid or oppose the muscle force; and the environment produces reaction forces back on the body. The actual motion is an emergent property of these interactions. To examine the roles of body stiffness, muscle activation, and fluid environment for swimming animals, a computational model of a lamprey was developed. The model uses an immersed boundary framework that fully couples the Navier-Stokes equations of fluid dynamics with an actuated, elastic body model. This is the first model at a Reynolds number appropriate for a swimming fish that captures the complete fluid-structure interaction, in which the body deforms according to both internal muscular forces and external fluid forces. Results indicate that identical muscle activation patterns can produce different kinematics depending on body stiffness, and the optimal value of stiffness for maximum acceleration is different from that for maximum steady swimming speed. Additionally, negative muscle work, observed in many fishes, emerges at higher tail beat frequencies without sensory input and may contribute to energy efficiency. Swimming fishes that can tune their body stiffness by appropriately timed muscle contractions may therefore be able to optimize the passive dynamics of their bodies to maximize peak acceleration or swimming speed.
Conflict of interest statement
The authors declare no conflict of interest.
Figures
Similar articles
-
The role of mechanical resonance in the neural control of swimming in fishes.Zoology (Jena). 2014 Feb;117(1):48-56. doi: 10.1016/j.zool.2013.10.011. Epub 2013 Dec 21. Zoology (Jena). 2014. PMID: 24433627 Free PMC article. Review.
-
The effect of intrinsic muscular nonlinearities on the energetics of locomotion in a computational model of an anguilliform swimmer.J Theor Biol. 2015 Nov 21;385:119-29. doi: 10.1016/j.jtbi.2015.08.023. Epub 2015 Sep 9. J Theor Biol. 2015. PMID: 26362101
-
Body stiffness and damping depend sensitively on the timing of muscle activation in lampreys.Integr Comp Biol. 2018 Nov 1;58(5):860-873. doi: 10.1093/icb/icy042. Integr Comp Biol. 2018. PMID: 29873726
-
Regulation of the swimming kinematics of lampreys Petromyzon marinus across changes in viscosity.J Exp Biol. 2023 May 1;226(9):jeb245457. doi: 10.1242/jeb.245457. Epub 2023 May 11. J Exp Biol. 2023. PMID: 37042277
-
Flexibility is a hidden axis of biomechanical diversity in fishes.J Exp Biol. 2023 Apr 25;226(Suppl_1):jeb245308. doi: 10.1242/jeb.245308. Epub 2023 Apr 22. J Exp Biol. 2023. PMID: 37086034 Review.
Cited by
-
Advantage of straight walk instability in turning maneuver of multilegged locomotion: a robotics approach.Sci Rep. 2016 Jul 22;6:30199. doi: 10.1038/srep30199. Sci Rep. 2016. PMID: 27444746 Free PMC article.
-
Proprioceptive feedback amplification restores effective locomotion in a neuromechanical model of lampreys with spinal injuries.Proc Natl Acad Sci U S A. 2023 Mar 14;120(11):e2213302120. doi: 10.1073/pnas.2213302120. Epub 2023 Mar 10. Proc Natl Acad Sci U S A. 2023. PMID: 36897980 Free PMC article.
-
The role of mechanical resonance in the neural control of swimming in fishes.Zoology (Jena). 2014 Feb;117(1):48-56. doi: 10.1016/j.zool.2013.10.011. Epub 2013 Dec 21. Zoology (Jena). 2014. PMID: 24433627 Free PMC article. Review.
-
Mechanical models of sandfish locomotion reveal principles of high performance subsurface sand-swimming.J R Soc Interface. 2011 Sep 7;8(62):1332-45. doi: 10.1098/rsif.2010.0678. Epub 2011 Mar 4. J R Soc Interface. 2011. PMID: 21378020 Free PMC article.
-
A pressure-based force and torque prediction technique for the study of fish-like swimming.PLoS One. 2017 Dec 7;12(12):e0189225. doi: 10.1371/journal.pone.0189225. eCollection 2017. PLoS One. 2017. PMID: 29216264 Free PMC article.
References
-
- Lauder GV, Tytell ED. In: Fish Biomechanics. Shadwick RE, Lauder GV, editors. San Diego: Academic; 2006. pp. 425–468.
-
- Long JH. Muscles, elastic energy, and the dynamics of body stiffness in swimming eels. Am Zool. 1998;38:771–792.
-
- Long JH, Adcock B, Root RG. Force transmission via axial tendons in undulating fish: A dynamic analysis. Comp Biochem Phys A. 2002;133:911–929. - PubMed
-
- Borazjani I, Sotiropoulos F. On the role of form and kinematics on the hydrodynamics of self-propelled body/caudal fin swimming. J Exp Biol. 2010;213:89–107. - PubMed
Publication types
MeSH terms
Grants and funding
LinkOut - more resources
Full Text Sources
