. 2011 Jan 21;286(3):2155-70.
doi: 10.1074/jbc.M110.188482. Epub 2010 Oct 31.

Cut-like homeobox 1 (CUX1) regulates expression of the fat mass and obesity-associated and retinitis pigmentosa GTPase regulator-interacting protein-1-like (RPGRIP1L) genes and coordinates leptin receptor signaling

Affiliations

Cut-like homeobox 1 (CUX1) regulates expression of the fat mass and obesity-associated and retinitis pigmentosa GTPase regulator-interacting protein-1-like (RPGRIP1L) genes and coordinates leptin receptor signaling

George Stratigopoulos et al. J Biol Chem. .

Abstract

The first intron of FTO contains common single nucleotide polymorphisms associated with body weight and adiposity in humans. In an effort to identify the molecular basis for this association, we discovered that FTO and RPGRIP1L (a ciliary gene located in close proximity to the transcriptional start site of FTO) are regulated by isoforms P200 and P110 of the transcription factor, CUX1. This regulation occurs via a single AATAAATA regulatory site (conserved in the mouse) within the FTO intronic region associated with adiposity in humans. Single nucleotide polymorphism rs8050136 (located in this regulatory site) affects binding affinities of P200 and P110. Promoter-probe analysis revealed that binding of P200 to this site represses FTO, whereas binding of P110 increases transcriptional activity from the FTO as well as RPGRIP1L minimal promoters. Reduced expression of Fto or Rpgrip1l affects leptin receptor isoform b trafficking and leptin signaling in N41 mouse hypothalamic or N2a neuroblastoma cells in vitro. Leptin receptor clusters in the vicinity of the cilium of arcuate hypothalamic neurons in C57BL/6J mice treated with leptin, but not in fasted mice, suggesting a potentially important role of the cilium in leptin signaling that is, in part, regulated by FTO and RPGRIP1L. Decreased Fto/Rpgrip1l expression in the arcuate hypothalamus coincides with decreased nuclear enzymatic activity of a protease (cathepsin L) that has been shown to cleave full-length CUX1 (P200) to P110. P200 disrupts (whereas P110 promotes) leptin receptor isoform b clustering in the vicinity of the cilium in vitro. Clustering of the receptor coincides with increased leptin signaling as reflected in protein levels of phosphorylated Stat3 (p-Stat3). Association of the FTO locus with adiposity in humans may reflect functional consequences of A/C alleles at rs8050136. The obesity-risk (A) allele shows reduced affinity for the FTO and RPGRIP1L transcriptional activator P110, leading to the following: 1) decreased FTO and RPGRIP1L mRNA levels; 2) reduced LEPR trafficking to the cilium; and, as a consequence, 3) a diminished cellular response to leptin.


Figures

FIGURE 1.
FIGURE 1.
Genomic organization of the human FTO/RPGRIP1L interval on chromosome 16. Red block denotes region of linkage disequilibrium (LD) that includes SNPs associated with increased body mass index (1, 2). Figure not drawn to scale.
FIGURE 2.
FIGURE 2.
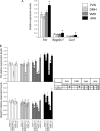
Fto/Rpgrip1l hypothalamic expression. A, Fto, Rpgrip1l, and Cux1 transcript levels, assessed by RT PCR, in the PVN, DMH, VMH, and arcuate hypothalamic nuclei of lean (+/+) C57BL/6J mice. *, ARH versus PVN, DMH, or VMH. B, assessment of Fto and Rpgrip1l mRNA levels in the PVN, DMH, VMH, and ARH of +/+ C57BL/6J mice compared with fasted +/+ mice, Lepob, as well as mice exposed to 4 °C. Mice were either administered leptin (fasted +/+) or saline (+/+, fasted +/+, 4 °C +/+, Lepob) intraperitoneally. Error bars represent one S.D. Asterisk indicates statistical significance (p < 0.05). Each column represents the mean of measurements from eight mice.
FIGURE 3.
FIGURE 3.
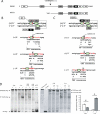
A, CUX1 is composed of an N-terminal autoinhibitory domain (AI), DNA-interacting cut-like repeats (CR) 1–3, and cut HD, as well as two repressor domains (R1 and R2) that do not interact with DNA. Cathepsin L cleaves P200 (at a site between CR1 and CR2) to P110 (21). Modeling of P200 (B) and P110 (C) binding affinities for the A (obesity risk) or C alleles of rs8050136. Consensus recognition sequences for CR1–3 and HD were determined from previous reports of in vitro binding experiments (27, 29). CR2 and CR3 domains recognize a degenerate sequence suggesting flexibility in DNA interaction, whereas CR1 or HD determines binding specificity. DNA consensus binding site for each DNA-binding domain (except HD domain) consists of an obligatory ATA sequence (in green and circled). Thus, the rs8050136 site has either three ATA sequences, including the A obesity-risk allele (two in the top and one in the reverse strand), that align with the predicted DNA binding consensus for P200, including CR1, CR2, and CR3, or two ATA and one ATC core sequence, including the rs8050136 C protective allele that aligns with the predicted DNA binding consensus for P110, including HD, CR2, and CR3. Boxed bases show the position of rs8050136 (A/C). D, nonradioactive EMSA using SYBR Green for DNA staining, Left panel, N2a cellular extracts enriched with human P200 or P110 mixed with double-stranded (DS) oligonucleotides carrying the A or C alleles. A double-stranded oligonucleotide in which the three predicted ATA recognition sequences were replaced with GGG (“M”) was also used as a control (described in supplemental Table 1). Band intensities were measured using Image J 1.36B (National Institutes of Health). Right panel, EM supershift assay using an antibody that recognizes the HD domain present in P200 and P110. Mouse IgG was used as a negative control. *, statistically significant (p = 0.001), comparing band intensity between 1st and 2nd and 3rd and 4th gel lanes (gel on left).
FIGURE 4.
FIGURE 4.
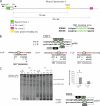
Sequence preference of p200 (Fto transcriptional repressor) and p110 (Fto and Rpgrip1l transcriptional activator) in the mouse. A, genomic organization of the mouse Fto/Rprgrip1l interval and Cux1-binding site on chromosome 8. B, modeling of p200 binding affinity for the mouse binding site. C, EMSA using N2a cellular extracts enriched with mouse p200 or p110 mixed with double-stranded (DS) oligonucleotides carrying the A or human C [M(C)] alleles. EM supershift assay was performed using an antibody that recognizes the HD domain present in p200 and p110. Mouse IgG was used as a negative control. *, statistically significant (p = 0.003), comparing major band intensity between 2nd and 3rd gel lanes.
FIGURE 5.
FIGURE 5.
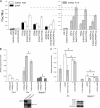
A, luciferase assay used to measure putative minimal FTO (FTO1p and FTO2p) and RPGRIP1L (RPGRIP1Lp) promoter activity upon human P200 ((pCMV) P200) or P110 ((pCMV) P110) overexpression or transfection with empty pCMV and in the presence or absence of the putative enhancer carrying the CUX1-binding A (Enh(A)) or C (Enh(C)) alleles. To control for background, extracts from cells transfected with empty pGL3 or pGL3 carrying the putative enhancer (Enh(A)+Enh(C)) in the absence of FTO1p, FTO2p, and RPGRIP1Lp were also assayed for luciferase activity. Transfection with 20 ng of Enh(C):FTO1p, Enh(C):FTO2p, or Enh(C):RPGRIP1Lp pGL3-based plasmids resulted in off-scale fluorescence intensity; only 2 ng of the above plasmids was used in this experiment. B, expression analysis in N41 cells overexpressing p200 or p110. C, expression analysis in primary neuronal cultures treated with leptin and/or cathepsin L inhibitor I. Each bar represents n = 3. Experiments were repeated twice. *, statistically significant. Used only for comparisons of data within close range (p values <0.01). Error bars represent S.D.
FIGURE 6.
FIGURE 6.
A, nuclear cathepsin L activity in the arcuate nucleus of lean (+/+), fasted +/+, and mice exposed to 4 °C and Lepob mice injected with saline intraperitoneally or fasted +/+ mice administered leptin intraperitoneally. p110 protein was measured in pooled nuclear extracts of fasted +/+, Lepob, and +/+ mice and mice exposed to 4 °C by Western blotting. *, statistically significant (p < 0.01).+/+ saline, significantly higher that +/+ fasted (saline); +/+ fasted (leptin), +/+ (4 °C) (saline), or Lepob (saline). B, Western blot showing p-Stat3 levels in whole protein extracts from primary neuronal cultures treated with cathepsin L inhibitor I (Cat. Inh. I) or DMSO. We failed to detect p110 species in nuclear fractions from neuronal cultures treated with cathepsin L inhibitor I. Experiments were repeated twice. Each error bar represents one standard deviation. p200, p110, nucleolin, p-Stat3, and β-tubulin-specific bands were variably exposed to film to achieve optimal quantitation range. Therefore, no comparisons should be made between different protein species.
FIGURE 7.
FIGURE 7.
A, N41 cells transfected with the Lepr-b::eGFP overexpression vector and treated with leptin. B, immunohistochemistry showing the arcuate hypothalamic region adjacent to the third ventricle from mice administered leptin peripherally. C, fasted mice; D, mice administered leptin and cathepsin L inhibitor I peripherally. Cilia are stained with an Adenylyl cyclase III (AcIII)-specific antibody.
FIGURE 8.
FIGURE 8.
Immunofluorescence of N41 cells co-transfected with the Lepr-b::eGFP overexpression vector. A, treated with 200 ng(/ml) of leptin for 6 h after becoming quiescent; B, no leptin treatment after becoming quiescent; C, co-transfected with Fto siRNA, grown for 48 h, and treated with leptin for 6 h after becoming quiescent; D, co-transfected with Rpgrip1l, grown for 48 h, and treated with leptin for 6 h after becoming quiescent; E, co-transfected with p200 overexpressing vector, grown for 48 h, and treated with leptin for 6 h after becoming quiescent; F, co-transfected with p110-overexpressing vector, grown for 48 h, and treated with leptin for 6 h after becoming quiescent; and G, treated with 200 ng(/ml) of leptin and cathepsin L inhibitor I (CatL inhib.) (10 μm) for 6 h after becoming quiescent. In vitro assessment of leptin receptor activity was by measurement of p-Stat3 levels in N41 cells co-transfected with the Lepr-b::eGFP overexpression vector. H, Fto-specific or Rpgrip1l-specific siRNA, grown for 48 h, and treated with leptin prior to becoming quiescent; I, p200 or p110 overexpressing (over.) vector, grown for 48 h, and treated with leptin prior to becoming quiescent. Quiescent N41 cells treated with Fto-specific scrambled siRNA displayed near identical p-Stat3 levels to N41 cells treated with Rpgrip1l-specific siRNA. p-Stat3 and β-tubulin-specific bands were variably exposed to film to achieve optimal quantitation range. Therefore, no comparisons should be made between different protein species.
FIGURE 9.
FIGURE 9.
Schematic representing the proposed model of FTO/RPGRIP1L rs8050136 allele-specific transcriptional regulation in response to feeding or fasting. Increased circulating leptin upon feeding leads to increased nuclear cathepsin L (CATL) activity in arcuate neurons expressing LEPR, increased P110 levels upon P200 cleavage by CATL, and in turn increased FTO/RPGRIP1L expression. By an unknown mechanism, FTO/RPGRIP1L facilitates LEPR clustering close to the base of the cilium at a site that may be the post-Golgi network (33, 70, 71) and/or the ciliary basal body (33). LEPR trafficking to the basal body may be facilitated by RPGRIP1L that localizes to the basal body protein complex (BBsome) and by FTO that may control expression of gene(s) implicated in LEPR trafficking. LEPR may multicluster at the membrane in the region of the cilium, thus enhancing leptin signaling. In some photoreceptor connecting cilia, RPGRIP1L localizes to the basal body as well as inside the cilium (9). Although we did not see LEPR inside the cilium, it is possible that the experimental conditions employed in this study limited our ability to visualize a small number of LEPR molecules transported into the cilium by RPGRIP1L. Fasting (low-leptin ambient condition) leads to decreased nuclear cathepsin L enzymatic activity in LEPR-positive arcuate neurons, decreased P110 levels, and decreased FTO/RPGRIP1L expression, resulting in dispersal of LEPR throughout the cell. Individuals with rs8050136 A (obesity risk), as opposed to individuals with rs8050136 C (protective) allele, display lower p110 binding, and thus lower FTO/RPGRIP1L expression levels causing decreased clustering of LEPR in close proximity to the cilium, resulting in less efficient leptin signaling. Abbreviations: PGN, post-Golgi network; BB, basal body.

Similar articles

Cited by

References

    1. Frayling T. M., Timpson N. J., Weedon M. N., Zeggini E., Freathy R. M., Lindgren C. M., Perry J. R., Elliott K. S., Lango H., Rayner N. W., Shields B., Harries L. W., Barrett J. C., Ellard S., Groves C. J., Knight B., Patch A. M., Ness A. R., Ebrahim S., Lawlor D. A., Ring S. M., Ben-Shlomo Y., Jarvelin M. R., Sovio U., Bennett A. J., Melzer D., Ferrucci L., Loos R. J., Barroso I., Wareham N. J., Karpe F., Owen K. R., Cardon L. R., Walker M., Hitman G. A., Palmer C. N., Doney A. S., Morris A. D., Smith G. D., Hattersley A. T., McCarthy M. I. (2007) Science 316, 889–894 - PMC - PubMed
    1. Scuteri A., Sanna S., Chen W. M., Uda M., Albai G., Strait J., Najjar S., Nagaraja R., Orrú M., Usala G., Dei M., Lai S., Maschio A., Busonero F., Mulas A., Ehret G. B., Fink A. A., Weder A. B., Cooper R. S., Galan P., Chakravarti A., Schlessinger D., Cao A., Lakatta E., Abecasis G. R. (2007) PLoS Genet. 3, e115 - PMC - PubMed
    1. Meyre D., Delplanque J., Chèvre J. C., Lecoeur C., Lobbens S., Gallina S., Durand E., Vatin V., Degraeve F., Proença C., Gaget S., Körner A., Kovacs P., Kiess W., Tichet J., Marre M., Hartikainen A. L., Horber F., Potoczna N., Hercberg S., Levy-Marchal C., Pattou F., Heude B., Tauber M., McCarthy M. I., Blakemore A. I., Montpetit A., Polychronakos C., Weill J., Coin L. J., Asher J., Elliott P., Järvelin M. R., Visvikis-Siest S., Balkau B., Sladek R., Balding D., Walley A., Dina C., Froguel P. (2009) Nat. Genet. 41, 157–159 - PubMed
    1. Thorleifsson G., Walters G. B., Gudbjartsson D. F., Steinthorsdottir V., Sulem P., Helgadottir A., Styrkarsdottir U., Gretarsdottir S., Thorlacius S., Jonsdottir I., Jonsdottir T., Olafsdottir E. J., Olafsdottir G. H., Jonsson T., Jonsson F., Borch-Johnsen K., Hansen T., Andersen G., Jorgensen T., Lauritzen T., Aben K. K., Verbeek A. L., Roeleveld N., Kampman E., Yanek L. R., Becker L. C., Tryggvadottir L., Rafnar T., Becker D. M., Gulcher J., Kiemeney L. A., Pedersen O., Kong A., Thorsteinsdottir U., Stefansson K. (2009) Nat. Genet. 41, 18–24 - PubMed
    1. Gerken T., Girard C. A., Tung Y. C., Webby C. J., Saudek V., Hewitson K. S., Yeo G. S., McDonough M. A., Cunliffe S., McNeill L. A., Galvanovskis J., Rorsman P., Robins P., Prieur X., Coll A. P., Ma M., Jovanovic Z., Farooqi I. S., Sedgwick B., Barroso I., Lindahl T., Ponting C. P., Ashcroft F. M., O'Rahilly S., Schofield C. J. (2007) Science 318, 1469–1472 - PMC - PubMed

Publication types

MeSH terms