. 2010 Dec;11(12):1085-92.
doi: 10.1038/ni.1955. Epub 2010 Oct 31.

A genetically selective inhibitor demonstrates a function for the kinase Zap70 in regulatory T cells independent of its catalytic activity

Affiliations

A genetically selective inhibitor demonstrates a function for the kinase Zap70 in regulatory T cells independent of its catalytic activity

Byron B Au-Yeung et al. Nat Immunol. 2010 Dec.

Abstract

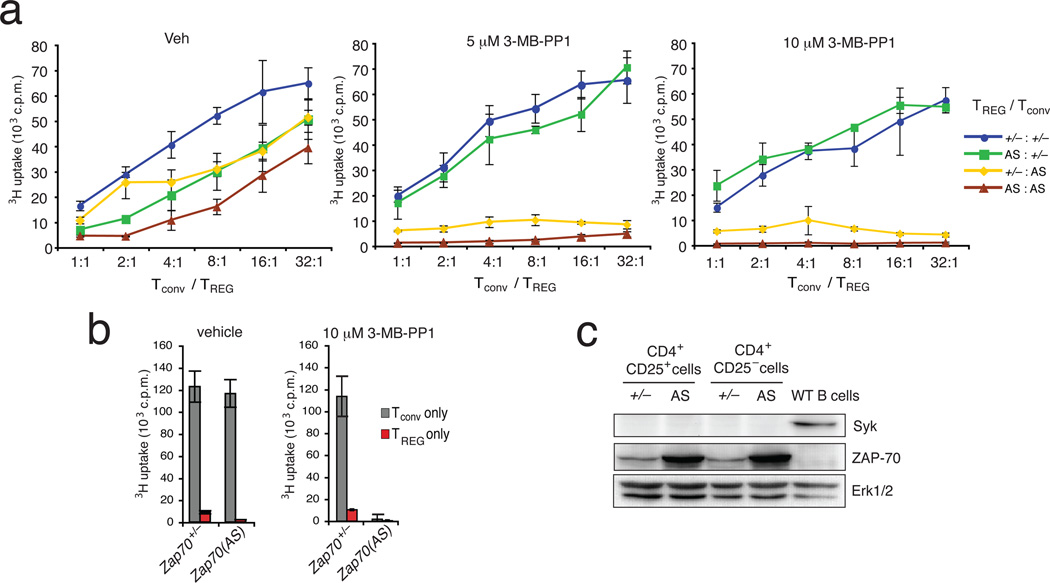
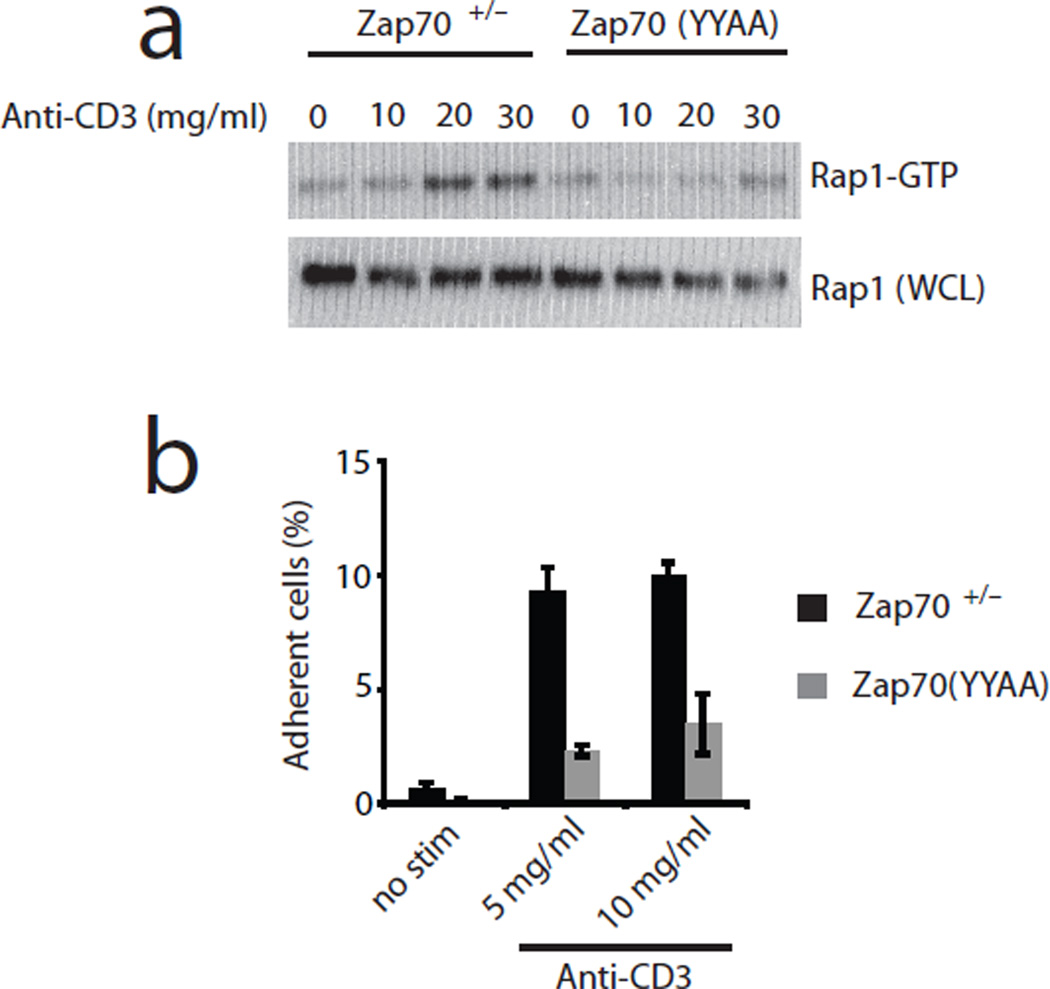
To investigate the role of the kinase Zap70 in T cells, we generated mice expressing a Zap70 mutant whose catalytic activity can be selectively blocked by a small-molecule inhibitor. We found that conventional naive, effector and memory T cells were dependent on the kinase activity of Zap70 for their activation, which demonstrated a nonredundant role for Zap70 in signals induced by the T cell antigen receptor (TCR). In contrast, the catalytic activity of Zap70 was not required for activation of the GTPase Rap1 and inside-out signals that promote integrin adhesion. This Zap70 kinase-independent pathway was sufficient for the suppressive activity of regulatory T cells (T(reg) cells), which was unperturbed by inhibition of the catalytic activity of Zap70. Our results indicate Zap70 is a likely therapeutic target.


Figures

Figure 1
Figure 1
T cell activation is dependent on ZAP-70 catalytic activity. (a) Flow cytometric analysis of Fluo-3 loaded Zap70+/− and Zap70(AS) CD4+ cells. For T cells, the arrows indicate 1) the simultaneous addition of 3-MB-PP1 and anti-CD3ε mAb and 2) the addition of crosslinking antibodies. For B cells, the arrow indicates the addition of anti-IgM plus the indicated doses of 3-MB-PP1. (b) Flow cytometric analysis of phospho-ERK staining in Zap70+/− (top) and Zap70(AS) (bottom) CD4+ T cells. Cells were stimulated with biotinylated anti-CD3ε and anti-CD4 plus streptavidin, in the presence of vehicle only (blue line), 5 µM (orange line), 10 µM (green line) and 10 µM 3MB-PP1 plus PMA (thin black line). Unstimulated cells are indicated by the filled gray histogram. (c) % of Zap70+/− (gray bars) and Zap70(AS) (black bars) T cells positive for CD69 after stimulation with plate-bound anti-CD3ε and anti-CD28 for 16 hours in the presence of 3-MB-PP1. Concentration of 3-MB-PP1 indicated on the x-axis. Percentages are normalized to vehicle-treated cells. (d) Immunoblot analysis of whole cell lysates from purified Zap70+/− and Zap70(AS) CD4+ T cells. Cells were left unstimulated, or stimulated with anti-CD3ε and crosslinking antibodies in the presence of vehicle, 5 µM, or 10 µM 3-MB-PP1 for 2 minutes. Blots probed with antibodies specific for the indicated epitopes. Data are representative of at least 3 independent experiments.
Figure 2
Figure 2
Proliferation by CD4+ T cells requires ZAP-70 catalytic activity. (a) Purified polyclonal CD4+ T cells from Zap70+/− (gray bars) and Zap70(AS) (black bars) were stimulated with plate-bound anti-CD3ε and anti-CD28 mAbs for 72 hours in the presence of vehicle or 3-MB-PP1; concentrations indicated below the x-axis. Data are presented as the mean 3H thymidine uptake from triplicate cultures. Error bars indicate the standard deviation of the mean. (b) CFSE loaded Zap70+/− (filled gray histogram) and Zap70(AS) (black line) OT-II T cells were stimulated with irradiated antigen presenting cells and 1 µM OVA323–339 peptide for 72 hours. The concentration of 3-MB-PP1 present in each culture is indicated above each plot.
Figure 3
Figure 3
Execution of effector T cell functions requires ZAP-70 catalytic activity. (a) Flow cytometric analysis of intracellular cytokine staining for IFNγ and IL-4 by effector TH1 and TH2 Zap70+/− and Zap70(AS) OT-II cells, respectively. Numbers within the dot plots indicate the percentage of cells within each quadrant. The concentrations of 3-MB-PP1 present in each culture are indicated above the dot plots. (b) Lysis of allogeneic 51Cr labeled P815 target cells by Zap70+/− and Zap70(AS) CTLs. Cell assay cultures containing effector and target cells were supplemented with vehicle alone (gray line), 10 µM 3-MB-PP1 (black), or CsA (dashed black line). (c) Alloreactive Zap70+/− (gray bars) and Zap70(AS) (black bars) CTLs, generated as in (b) were stimulated by P815 cells in the presence of 3-MB-PP1 (top) or CsA (bottom). Numbers on the x-axis indicate the final concentration of 3-MB-PP1 (µM) or CsA (µg/ml). Data are representative of 3 experiments.
Figure 4
Figure 4
CD8 memory responses are dependent on ZAP-70 catalytic activity. (a,b) Flow cytometric analysis of LCMV (a) GP33–41-specific and (b) NP396–404-specific IFNγ and TNFα production by Zap70+/− and Zap70(AS) memory CD8+ cells. Contour plots are gated on CD8+ CD44high memory cells. The concentrations of 3-MB-PP1 present are indicated above the plots. (c, d) Graphs display the percentage of IFNγ+ TNFα+ cells at each concentration of 3-MB-PP1 tested. Percentages are of CD8+ CD44high memory Zap70+/− (black line) and Zap70(AS) (gray line) cells. Error bars indicate the standard deviation from the mean; n=3. Data are representative of 3 experiments.
Figure 5
Figure 5
ZAP-70 catalytic activity is dispensable for TREG cell suppressive activity in vitro. (a) In vitro suppression assays used CD4+CD25 Tconv cells from both Zap70+/− and Zap70(AS) mice, together with irradiated antigen-presenting cells, anti-CD3ε mAbs, and titrated numbers of Zap70+/− or Zap70(AS) CD4+CD25+ TREG cells. Cultures were set up in the presence of vehicle alone, 5 µM, or 10 µM 3-MB-PP1. Data are presented as the average 3H thymidine uptake in triplicate cultures. Error bars indicate the standard deviation of the mean. (b) Bar graphs show the 3H thymidine uptake of Tconv or TREG cells alone in the presence of vehicle alone or 3-MB-PP1. (c) Immunoblots of whole cell lysates from purified Zap70+/− and Zap70(AS) Tconv and TREG cells were probed for expression of Syk, ZAP-70, and ERK1-ERK2. Data in all panels are representative of at least 3 experiments.
Figure 6
Figure 6
TCR-induced activation of Rap1 and adhesion to ICAM-1 are ZAP-70 kinase-independent. (a) CD4+CD25 Tconv and CD4+CD25+ TREG cells were loaded with Fluo-3 and Fura Red for analysis of intracellular calcium levels by flow cytometry. Cells were stimulated in the presence of vehicle alone (red) or 3-MB-PP1 (blue). Arrow “1” indicates the addition of biotinylated anti-CD3ε and anti-CD4, arrow “2” indicates the addition of streptavidin, and arrow “3” indicates the addition of ionomycin. Tconv were >99% Foxp3 and TREG cells were >98% Foxp3+. (b) Splenocytes were stimulated ex vivo by crosslinking anti-CD3 mAbs and stained for phospho-ERK. Histograms are gated on Foxp3-negative or Foxp3-positive CD4+ cells. Cells were either unstimulated (filled gray histograms) or stimulated in the presence of vehicle alone (red), 5 µM 3-MB-PP1 (green), 10 µM 3-MB-PP1 (blue), or 10 µM 3-MB-PP1 plus PMA (gray line). (c) CrkII was immunoprecipitated (IP) from Zap70(AS) thymocyte lysates. Cells were stimulated by crosslinking anti-CD3 mAbs for 2 minutes. Immunoprecipitated proteins were immunoblotted (IB) for ZAP-70 and CrkII (top). Whole cell lysates were also immunoblotted for the presence of ZAP-70 and CrkII (bottom). (d) Pull-down assay for Rap1-GTP in Zap70+/− and Zap70(AS) thymocytes. Cells were left unstimulated, or stimulated with crosslinked anti-CD3ε mAb for 2 minutes. The concentrations of 3-MB-PP1 are indicated. Total Rap1 levels in whole cell lysates are shown below. (e) CD4+ T cells from Zap70+/− and Zap70(AS) were stimulated with anti-CD3ε for 10 minutes in wells coated with recombinant ICAM-1. Cells were then washed and counted by flow cytometry. Data in all panels are representative of 3 independent experiments.
Figure 7
Figure 7
TCR-induced activation of Rap1 and adhesion to ICAM-1 are dependent on ZAP-70 adapter function. (a) Rap1 pulldown assay from Zap70+/− and Zap70(YYAA) thymocytes. Cells were stimulated with the indicated doses of anti-CD3ε for 2 minutes in the absence of 3-MB-PP1. (b) TCR-induced ICAM-1 adhesion by Zap70+/− and Zap70(YYAA) T cells. Peripheral CD4+ T cells were stimulated as in Fig. 6d with the indicated doses of anti-CD3ε. Data are representative of 3 independent experiments.

References

    1. Au-Yeung BB, et al. The structure, regulation, and function of ZAP-70. Immunol Rev. 2009;228:41–57. - PubMed
    1. Koretzky GA, Abtahian F, Silverman MA. SLP76 and SLP65: complex regulation of signalling in lymphocytes and beyond. Nat Rev Immunol. 2006;6:67–78. - PubMed
    1. Horejsi V, Zhang W, Schraven B. Transmembrane adaptor proteins: organizers of immunoreceptor signalling. Nat Rev Immunol. 2004;4:603–616. - PubMed
    1. Kadlecek TA, et al. Differential requirements for ZAP-70 in TCR signaling and T cell development. J Immunol. 1998;161:4688–4694. - PubMed
    1. Negishi I, et al. Essential role for ZAP-70 in both positive and negative selection of thymocytes. Nature. 1995;376:435–438. - PubMed

Publication types

MeSH terms

Substances